
Wafer Fab Equipment: $150B market, 23% YoY. Foundry/Logic and HBM Intensity drive growth
Wafer-Fab Equipment (WFE) spending has accelerated to $150B+ in 2026 as AI infrastructure transitions to complex 3D integration. While macro forecasts project ~20%+ annual growth through 2027, top-line figures mask sub-segment divergence. Foundry/Logic (led by TSMC’s N2/A16 transition) and DRAM (driven by HBM3e/HBM4 wafer intensity) take ~75% of market growth. Stock selection hinges on tool exposure: ASML commands a leading-edge lithography monopoly constrained only by shipping capacity; KLA (KLAC) offers high-margin (+62.4% GM) as gate-all-around adds defect steps; Lam Research (LRCX) is cushioned by a 37% service base; and Applied Materials (AMAT) provides broad multi-node exposure.
Wafer Fab Equipment: $150B market, 23% YoY. Foundry/Logic and HBM Intensity drive growth
Oct 16 | ASML +3/10 Long | AMAT +3/10 | LRCX +6/10 | KLAC +4/10
Takeaway: Wafer-Fab Equipment (WFE) spending has accelerated to $150B+ in 2026 as AI infrastructure transitions to complex 3D integration. While macro forecasts project ~20%+ annual growth through 2027, top-line figures mask sub-segment divergence. Foundry/Logic (led by TSMC’s N2/A16 transition) and DRAM (driven by HBM3e/HBM4 wafer intensity) take ~75% of market growth. Stock selection hinges on tool exposure: ASML commands a leading-edge lithography monopoly constrained only by shipping capacity; KLA (KLAC) offers high-margin (+62.4% GM) as gate-all-around adds defect steps; Lam Research (LRCX) is cushioned by a 37% service base; and Applied Materials (AMAT) provides broad multi-node exposure.
Research series: This article synthesises our Wafer-Fab Equipment research, examining how equipment makers capture the multi-gigawatt capex funded by hyperscalers. Earlier research: TSMC, KLAC, AMAT, ASML, LRCX, AI and Advanced Packaging, TSMC, KLIC, ASX, Teradyne.
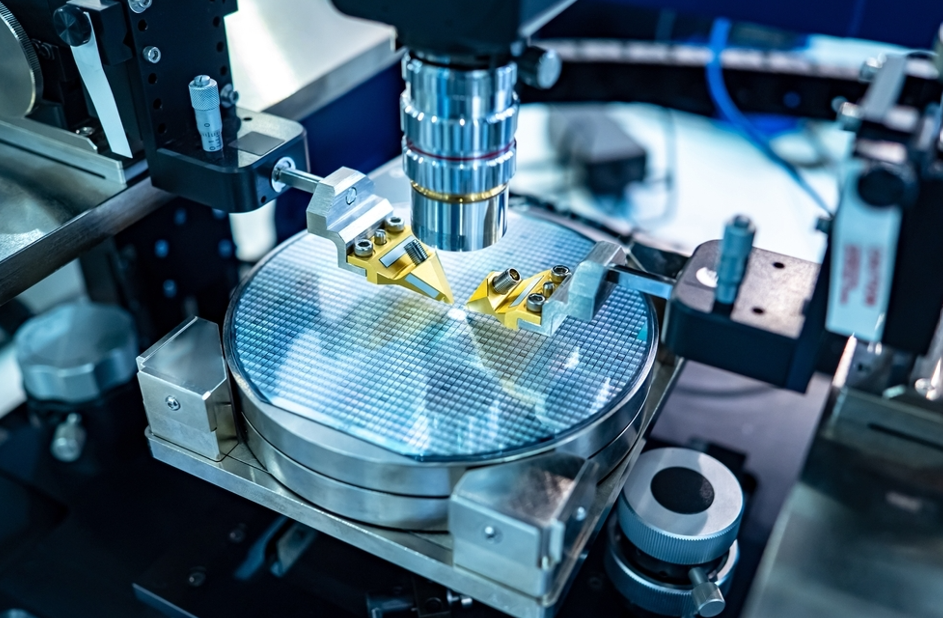
Equipment industry associations and toolmakers agree that global WFE spending is entering a multi-year expansion cycle, but individual toolmakers (ASML, Applied Materials, Lam and KLA) face different demand based on their market exposure.
SEMI’s July forecast
SEMI (Semiconductor Equipment and Materials International, the global industry association for chip equipment and materials suppliers):
$116.9B in 2025, $143.9B in 2026 (+23.1%), then +21.8% in 2027 and +14.1% in 2028, which reaches the “$200 billion mark” (SEMI).
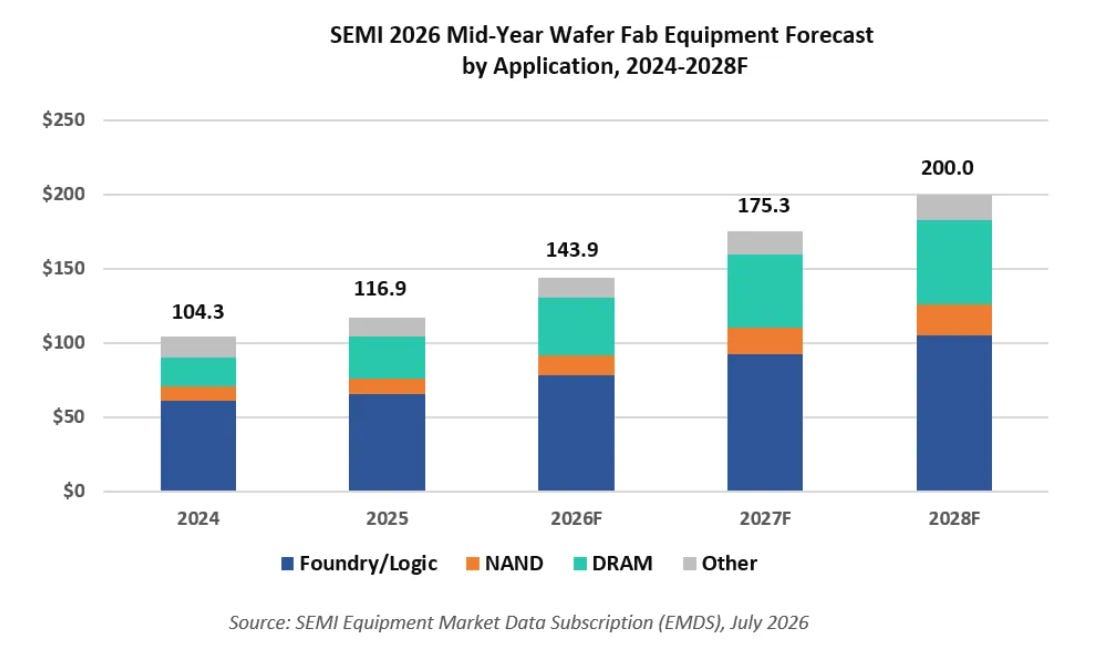
Company and analyst figures sit higher for 2026. KLA puts calendar 2026 in the low-$150B range, up from “$140 billion-plus”, against about $120B in 2025, and counts advanced packaging (KLA). Lam also says low-$150B (Lam call).
Where the growth is
Foundry and logic and DRAM contribute about 3/4 of the growth in 2028.
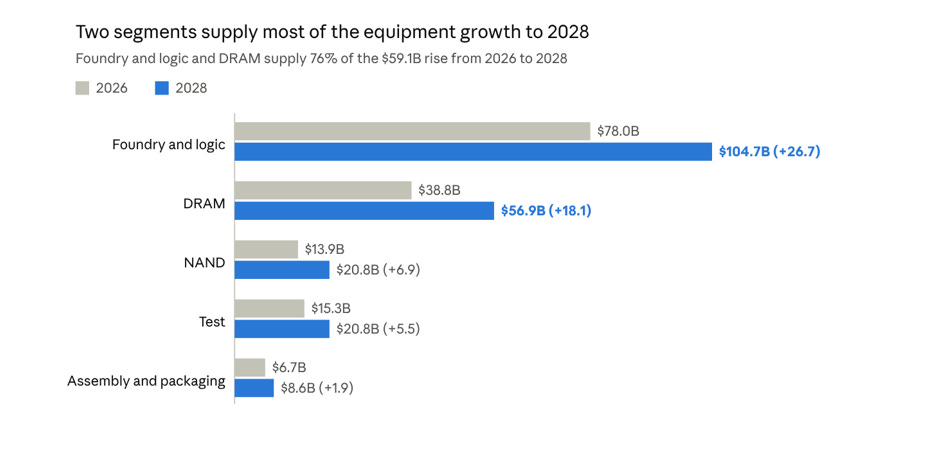
SEMI ties the growth to AI demand: advanced-node buildouts and the move to 2nm gate-all-around in foundry and logic, HBM and node migration in DRAM, 3D NAND layer migration, AI and HBM reliability testing, and advanced and heterogeneous packaging.
Growth drivers simplified
Advanced-node buildouts and the move to 2nm gate-all-around (Foundry and Logic)
What it means: “Logic” chips (e.g. Nvidia GPUs or Google TPUs). “2nm” is the newest manufacturing standard.
To make AI processors faster and use less electricity, engineers pack tens of billions of tiny transistors onto a single piece of silicon. Older switches were built like a “fin” standing up, with the control gate touching 3 sides (FinFET). At 2nm, those fins leak too much electricity, so chipmakers are switching to Gate-All-Around (GAA)—where the gate wraps around all 4 sides of microscopic silicon wires/sheets.
Why it drives growth: Building 3D “gate-all-around” channels requires completely new, hyper-precise etching and layer-coating machines. Chipmakers cannot reuse old equipment; they have to buy brand-new tools.
HBM and node migration in DRAM
What it means: DRAM is the fast temporary memory chips use. HBM (High-Bandwidth Memory) is a special, high-speed version that sits right next to AI chips. “Node migration” means upgrading factory lines to print smaller memory circuits.
AI models need massive amounts of data at lightning speed. Standard memory sticks are too slow, so memory makers stack 8, 12, or 16 DRAM chips vertically on top of each other and connect them with thousands of tiny vertical wires.
Why it drives growth: Stacking memory eats up enormous factory space. HBM uses roughly 3 times as much silicon wafer area per bit of memory compared to standard PC memory. To keep up with AI demand without running out of standard memory, factories must buy huge fleets of new tools to make smaller memory cells and stack them.
3D NAND layer migration
What it means: NAND is the permanent storage memory (like the solid-state drive in a phone or cloud server).
Instead of trying to shrink memory cells sideways on a flat chip, manufacturers stack storage cells vertically like floors in a skyscraper. “Layer migration” means moving from 200-story buildings to >300-story buildings.
Why it drives growth: Drilling microscopic “elevator shafts” through 300+ layers of silicon without drifting or breaking requires specialized, high-power chemical etching and deposition machines from Lam Research and Applied Materials.
AI and HBM reliability testing
What it means: Checking that the chips work before they leave the factory.
If a single 12-chip HBM stack has one broken wire inside, or if a $40,000 AI GPU fails inside a data center, it ruins the whole server. Testing an intricate 3D chip or an HBM stack requires rigorous, time-consuming inspections.
Why it drives growth: Chipmakers are buying record amounts of high-tech testing and laser inspection equipment from KLA to catch defects early.
Advanced and heterogeneous packaging
What it means: “Packaging” is the outer casing and high-speed electrical wiring that connects finished chip pieces together into a single unit. “Heterogeneous” means mixing different types of chips inside the same package.
AI chips have grown too big to print as a single monolithic piece of silicon. Instead, engineers print separate “chiplets” (e.g., compute chips, memory stacks, power chips) and glue them onto a shared base plate with sub-micron precision so they act as one mega-chip.
Why it drives growth: In the past, packaging was a low-tech “assembly” step done in cheap back-end factories. Now, placing chiplets side-by-side with microscopic precision requires advanced, ultra-high-precision robotics and thermo-compression bonders.
China, Taiwan and Korea remain the top three regions through 2028. SEMI expects China to stay first but its growth to moderate in 2026, and Lam’s CFO Doug Bettinger expects China WFE to be flat to slightly up.
Macro Trends Shaping WFE
AI Capex Asymmetry: Hyperscale AI investments are skewing equipment spend heavily toward leading-edge logic (2nm GAA nanosheets) and high-density memory (HBM3e/HBM4).
Process Intensity Explosion: Physical scaling limits mean transistor density is now achieved through complex 3D structures (3D GAA, 3D NAND >300 layers, HBM 12/16-die stacks) and advanced packaging (CoWoS, CoPoS, panel-level glass substrates). This increases the number of deposition, etch, and inspection steps per wafer.
Geopolitical Fab Redundancy: Sovereign semiconductor initiatives (U.S. CHIPS Act, European Chips Act, Japan METI subsidies) are driving geographic duplication of fab capacity (Arizona, Dresden, Kumamoto), sustaining structural baseline tool demand.
Foundry and logic: TSMC's capex sets the pace
Foundry and Logic forms the largest individual share of equipment spending, projected by SEMI to grow from $78.0B in 2026 to $104.7B by 2028. Spending is heavily concentrated, with TSMC commanding 72.5% of top-10 foundry revenue in Q2 2026 (TrendForce).
What it is
The manufacture of digital logic chips: CPUs, GPUs, custom AI ASICs, mobile systems-on-chip and microcontrollers, as opposed to memory. Pure-play foundries make chips designed by others (Apple, AMD, Nvidia, Qualcomm); integrated device manufacturers (IDMs) design and build their own, and Intel does both. SEMI reports all of it as one equipment segment. There are two tiers: leading-edge nodes (3nm, 2nm, Intel 18A) and mature nodes (by industry convention 28nm and above), which make power-management, display, automotive and analog chips.
Key buyers
Q2 2026 foundry revenue shares: TSMC 72.5%, Samsung Foundry 5.9%, SMIC 5.4%, UMC 3.9%, GlobalFoundries 3.2% (TrendForce). Logic IDMs include Intel, Texas Instruments, STMicroelectronics and NXP. Equipment spending plans:
TSMC: 2026 capex $60–64B reiterated.
Intel: 2026 capex above $20B and higher in 2027.
Terafab (SpaceX and Tesla, a planned chip campus in Grimes County, Texas): $16.8B of committed initial equipment spending, per Goldman. TSMC said discussions with Terafab are not concluded. Goldman’s forecast: foundry WFE $58B, $84B and $109B for 2026–28; logic and other $34B, $47B and $53B, with Terafab driving most of the logic growth.
Chinese mature-node fabs: SMIC ran at 93.7% utilisation in Q2 with monthly capacity of 1.1 million 8-inch equivalents. Hua Hong ran at 102.8% and is building Fab 9B in Wuxi (RMB 3.8B, 55,000 12-inch wafers a month, due January 2027) (TrendForce).
Equipment types and suppliers
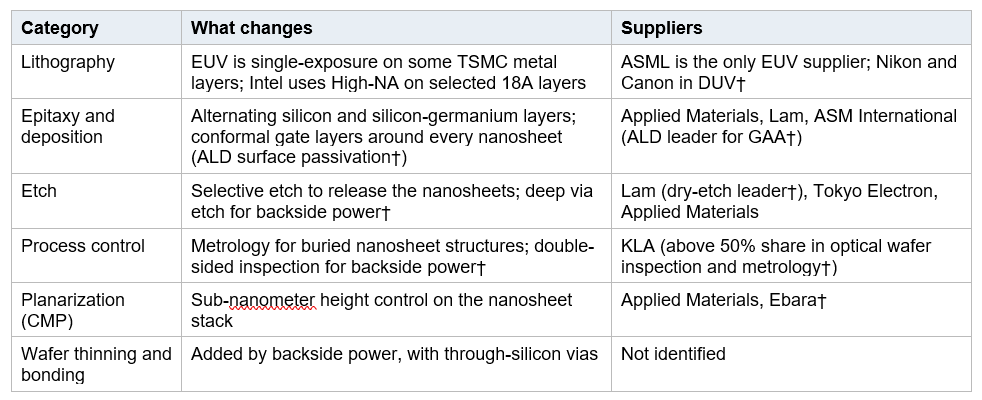
Exposure to logic: ASML sells 54% of its systems to logic, and KLA sells 79% of its process-control systems to foundry and logic. AMAT and Lam do not disclose the split.
Growth drivers
Gate-all-around (GAA) replaces FinFET at 2nm. Ben Bajarin (The Diligence Stack) estimates capex per 50,000 wafers of capacity at about $16B for N5 and nearly $30B for N2, with 50–70% tool overlap in earlier transitions and much less at N2 (his estimate; detail paywalled). TSMC’s CFO Wendell Huang: “tool price inflation is real.”
Backside power (TSMC A16, Intel PowerVia) routes power through the back of the wafer and adds thinning, bonding and via steps. TSMC gave no A16 date on its Q3 call.
A broader 2nm base. N2 was 8% of TSMC’s Q3 wafer revenue and N2-family capacity is to more than double in 2027. SemiAnalysis: “At 2nm the field returns, and it is bigger than one rival. Google, Qualcomm, MediaTek, and AMD all bring 2nm silicon to market around the same time as Apple, whereas N3’s first year belonged to Apple alone”.
AI demand. High-performance computing (HPC), TSMC’s data-centre and AI chip platform, was 68% of TSMC’s Q3 revenue; TSMC expects its AI accelerator revenue to grow faster than a mid-to-high 50s % CAGR.
Advanced packaging. CoWoS at 5x reticle size is in volume, with 9x and 14x in development. SEMI counts packaging equipment in its separate assembly and packaging segment ($6.7B in 2026 to $8.6B in 2028). Thermocompression bonder suppliers are Kulicke & Soffa, ASMPT and Shibaura.
China
Domestic tools were 35% of Chinese equipment purchases in 2025, up 10 points from 2024, per the China Semiconductor Industry Association (Jan 14, 2026). Etch and thin-film deposition are above 40%, metrology 25% and lithography 18%. AMEC’s 5nm etch tools are in validation at TSMC. Beijing reportedly requires 50% domestic tools for new fab approvals. China was about 20% of ASML’s 2026 sales and 26% for AMAT, Lam and KLA.
Government
The Section 232 proclamation of Jan 14, 2026 puts a 25% tariff on a narrow set of advanced AI chips. Equipment was investigated but has no tariff now; the proclamation signals that “significant” tariffs could follow, with an offset for US investment (Global Policy Watch). The US–Taiwan deal of Jan 15 pledges at least $250B of Taiwanese investment plus $250B of credit guarantees.
Takeaway
The segment’s direction is set by TSMC’s capex and N2 conversion. ASML and KLA are the most directly exposed, and the process-flow changes add etch, deposition and metrology content.
DRAM: HBM absorbs wafers, so equipment orders follow
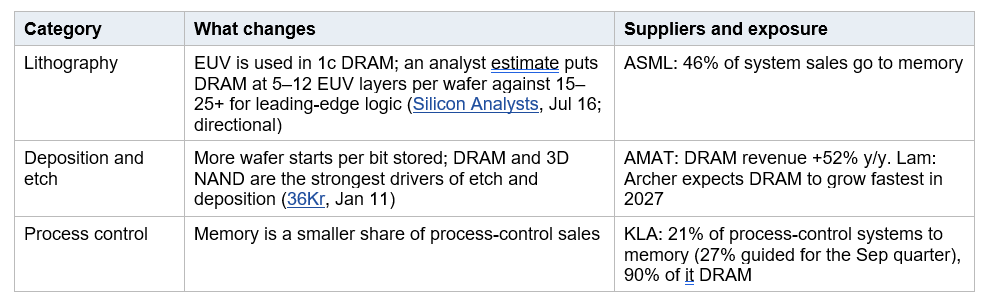
HBM uses about three times the wafer area per bit of standard DRAM, so every point of capacity moved to HBM removes two to three times as much conventional supply; that is why SEMI has DRAM equipment spending rising 39.0% in 2026 to $38.8B and reaching $56.9B in 2028.
What it is
DRAM is the working memory that holds the data a processor is using. Conventional DRAM (DDR5 in servers and PCs, LPDDR in phones) is sold in modules. High-bandwidth memory (HBM) stacks several DRAM dies and sits beside an AI accelerator, so one HBM stack takes the wafer area of several standard chips.
Key buyers
Q2 2026 DRAM revenue shares: Samsung 39.4%, SK hynix 24.9%, Micron 23.3%, CXMT 9.5%.
Equipment spending plans:
SK hynix: H1 2026 capex 18.33T (~$13.7B) won (+72.7%); Yongin first-fab cleanroom February 2027; 35.2T won (~$26.2B) approved for Yongin Y2; 19.1T won ($14.2B) for M17 NAND.
Micron: fiscal Q4 capex $10.8B and about $25B planned for H1 FY27; it sees industry bit growth in the low 20s % in 2027–28.
Samsung: HBM wafer input reported at about 180,000 a month rising to about 250,000 in 2027.
CXMT: says it expects to launch a 4F² server DDR5 module before end 2026.
Equipment types and suppliers
Growth drivers
Wafer intensity of HBM. TrendForce (Sep 29): as HBM’s share of capacity rises from 20% to 30%, conventional supply is displaced two to three times as fast. Bajarin puts HBM3e at about 3x the wafer capacity of DDR5 per bit and HBM4 at 4:1 (his estimate).
Cloud capex. TrendForce (Aug 25) projects cloud capex up 98% in 2026 and 50% in 2027, with DRAM and NAND taking 47% of it in 2026 and 68% in 2027.
Prices. TrendForce projects server DRAM contract prices up about 270% in 2026 and HBM contract prices up 70–140% in 2027. For 4Q26 it expects conventional DRAM contract prices up 10–15% quarter on quarter, which it calls moderating. Micron guides fiscal Q1 FY27 gross margin near 86.25% and calls it a floor for the year.
Demand mix. Micron sees server unit growth in the high teens; TrendForce says server DRAM is undersupplied and consumer demand is weak.
China and policy
CXMT’s 9.5% share and the domestic-tool push (etch and deposition above 40% localised, lithography 18%) are the channel through which export controls reach DRAM equipment. Micron reportedly lobbied for the MATCH Act.
Cycle risk
Takashi Yunogami of Japan’s Precision Processing Research Institute expects an inflection around 2027–28, noting that memory growth has not stayed positive more than five consecutive years since 1991; his argument is physical limits on power, water and tools, not new supply (BigGo, Jul 23).
The test is whether the capex above arrives as bit supply faster than server demand. DRAM is where Lam’s expected 2027 growth, AMAT’s DRAM revenue and ASML’s memory share are most exposed to the memory cycle; KLA is the least exposed.
How ASML, AMAT, LRCX and KLAC positioned and what to own
All four are paid out of the same capex budget, but each sells a different part of it, so each responds to different drivers.
ASML sells lithography, needed at every new node; limit is supply, not demand.
Applied Materials sells the broadest range: deposition, etch and more, with growing packaging and process-control businesses.
Lam sells etch and deposition, and earns the most from servicing tools already installed.
KLA sells process control, which scales with the number of process steps rather than the number of wafers.
What the cycle means for each stock
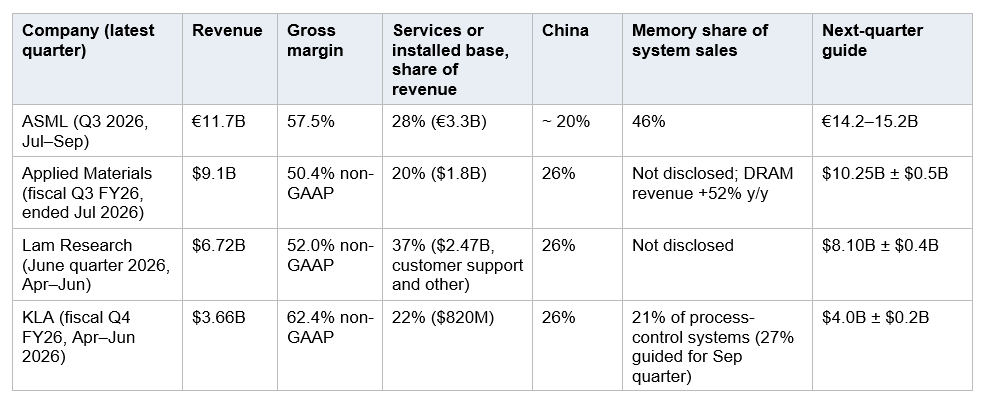
ASML: the cleanest logic exposure, limited by capacity. Every 2nm and DRAM EUV layer needs its tools, and demand is not the constraint. Revenue in 2027 depends on how fast it can ship (capacity up about 30%), and pricing helps from 2027: CFO Roger Dassen said value-based pricing has no effect in 2026, some in 2027 and a fuller effect in 2028. The risk is timing rather than demand. If customers’ clean rooms limit installation, shipments slip: CEO Christophe Fouquet does not see clean-room limits as a major factor, while Lam’s CFO and Applied Materials say they are.
Applied Materials: the broadest mix, so the least precise bet. It benefits from gate-all-around logic, HBM and packaging, but has the lowest gross margin (50.4%). DRAM revenue grew 52% year on year, and packaging revenue is expected to grow more than 70% in calendar 2026. Process diagnostics and control are expected to grow more than 50%, which overlaps with KLA. Fiscal Q4 guidance of $10.25B ± $0.5B is up 51% year on year.
Lam Research: the memory leverage, cushioned by service. CEO Tim Archer sees “an extraordinary setup for WFE growth” in 2027 and expects DRAM to grow fastest. Customer support and other was $2.47B of $6.72B (37%) and does not fall as sharply in a downturn. September-quarter guidance of $8.10B ± $0.4B is about 20% above June. Lam is the stock most exposed if DRAM spending peaks around 2027–28.
KLA: logic and complexity, with the highest margin. Process control grows with every added step: gate-all-around, backside power and packaging. Gross margin is 62.4%, 79% of June-quarter systems revenue came from foundry and logic, and the memory share is guided up to 27% for the September quarter, 90% of it DRAM. The September quarter is guided to $4.0B ± $0.2B.
What to own
Scores and targets are from our reports of Oct 12 to 15.
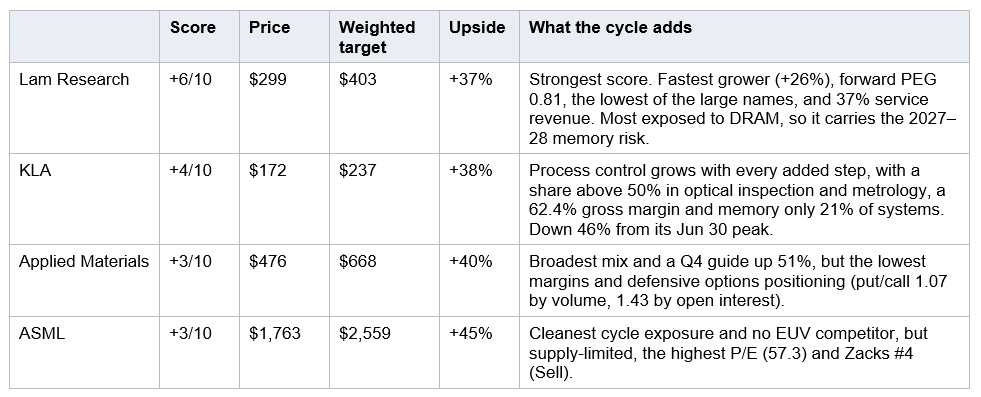
Which to own depends on the view you take:
Memory and HBM keep growing into 2027: Lam is the highest-scoring and most leveraged position.
AI capex keeps growing, led by logic and packaging: KLA is the steadier choice. ASML is the cleanest exposure to the cycle, but its valuation is already high.
Lower cycle risk: Lam’s 37% service share and ASML’s 28% installed-base share cushion revenue more than KLA’s (22%) or Applied Materials’ (20%).
Applied Materials: the evidence does not separate it from the others, and its score reflects that.
Key uncertainties
The forecast depends on five things:
AI financing. Lam estimates each $100B of AI data-centre capex produces about $8B of WFE, after raising that by $1–2B. On Oct 8 an FT report put OpenAI’s annualised revenue near $50B, about $20B below the prior month’s projection; the Philadelphia Semiconductor Index fell 3.4% and Broadcom 4.35% (Euronews).
China. It is 26% of the latest quarter at AMAT, Lam and KLA and about 20% of ASML’s 2026 sales. Lam expects China WFE to be flat to slightly up, and Micron has reportedly pushed Congress for tighter equipment controls through the MATCH Act.
Memory. DRAM carries the largest upward revisions: SEMI has DRAM WFE up 39.0% in 2026, and it was Goldman’s largest revision. KLA cited memory pricing pressure in its gross margin, and CXMT says it expects to launch a 4F² server DDR5 RDIMM by year-end, while Samsung’s 4F² production is reported for 2028.
Timing. ASML plans about 30% more EUV and immersion capacity in 2027, so shipments, not orders, set 2027 revenue.
2027 and valuation. Lam’s CFO said “it’s too soon for us to put quantification around what ‘27 is going to be”, and KLA plans for “significant growth” without a figure. Barclays wrote in June that “’28 is already contemplated in these names”; share prices are not updated in this draft.
Sources
Research is for information only, not advice
Semiconductors
Explore all company fundamental valuations, DCF intrinsic models, and thematic deep-dives in Semiconductors.
Quantitative Models
Automated daily equity screening across 6 quantitative factor models with 15-minute EMA regime confirmation.
More Research from the Desk
Intel Inc (INTC) earnings: data center jumps 78%, but Q4 guidance cut triggers 25% sell-off
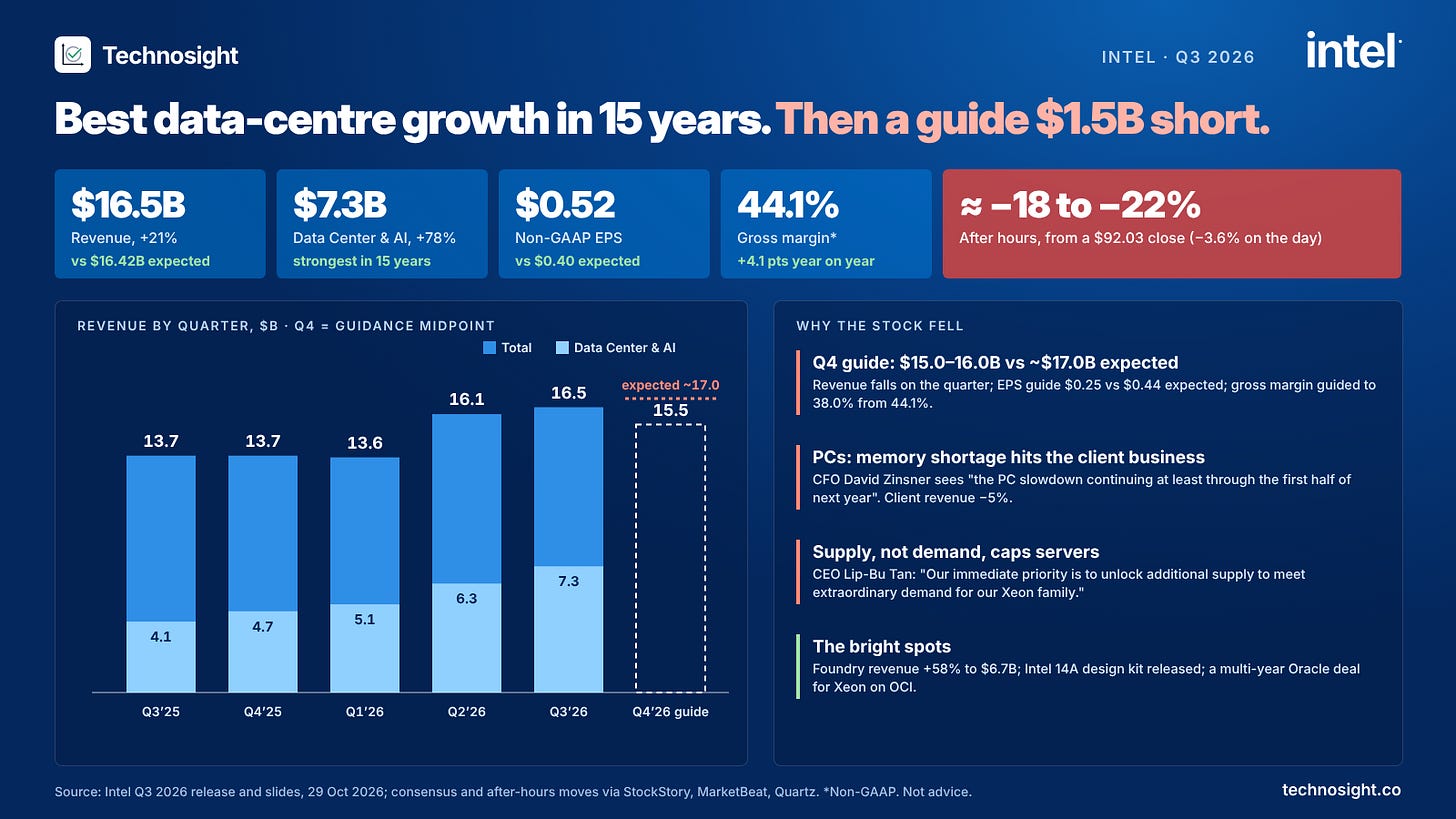
Intel’s Q3 print delivered a stark contrast between a surging Data Center business (+78% YoY to $7.3B) and a severe guidance reset. While Q3 beat top- and bottom-line estimates ($16.5B revenue, $0.52 non-GAAP EPS), Q4 revenue guidance ($15.0B–$16.0B vs. $17.1B consensus) sent shares down ~25% pre-market. Management highlighted supply bottlenecks in substrate packaging, a memory-driven PC downturn running into H1 2027, and a $300M revenue hit from the Fab 28 explosion in Israel. With capex ramping for 18A/14A and 2027 expected to be cash-flow negative, we adjust the score from -2/10 to -1/10 Neutral.
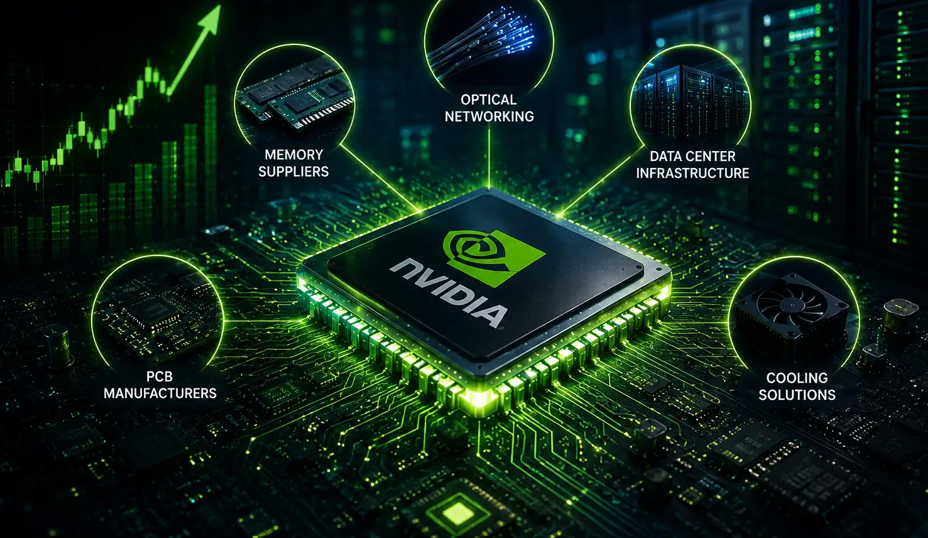
Nvidia’s $279B supply bill and $48B in stakes: a map of AI’s shortages and demand props
Nvidia is paying for the capacity it depends on, and the payments show where AI infrastructure shortages are. Supply and capacity commitments rose from $119B to $279B in one quarter, “primarily related to memory,” with $267B due by FY29. Supplier stakes are small beside that: $2B each in Lumentum and Marvell, Coherent and Synopsys. Non-marketable equity grew from $3.8B to $47.9B in a year, a further $25B is committed to AI model makers and infrastructure financiers, and guarantees reach up to $108.5B. The commitments rank memory as the tightest constraint, then power and data-centre capacity, then optics. The exposure runs both ways: Nvidia’s $23.7B of first-half equity gains and its commitments depend on the demand that payments help to create.