
Hyperscalers and neoclouds after Q3: capacity is the constraint, investment flows to whoever has it
AI spending has not slowed; capacity has. With power, not money, setting the pace, the gains go to the companies that own powered capacity and pay for it from cash: Microsoft first, then Amazon and Alphabet. Meta and Oracle now fund the gap with new shares and debt, and the neoclouds carry the delay as interest. Of this month’s dips, Alphabet is the one our scores back: +5, below its 3-year EV/EBITDA low, and holding its March base at $272.
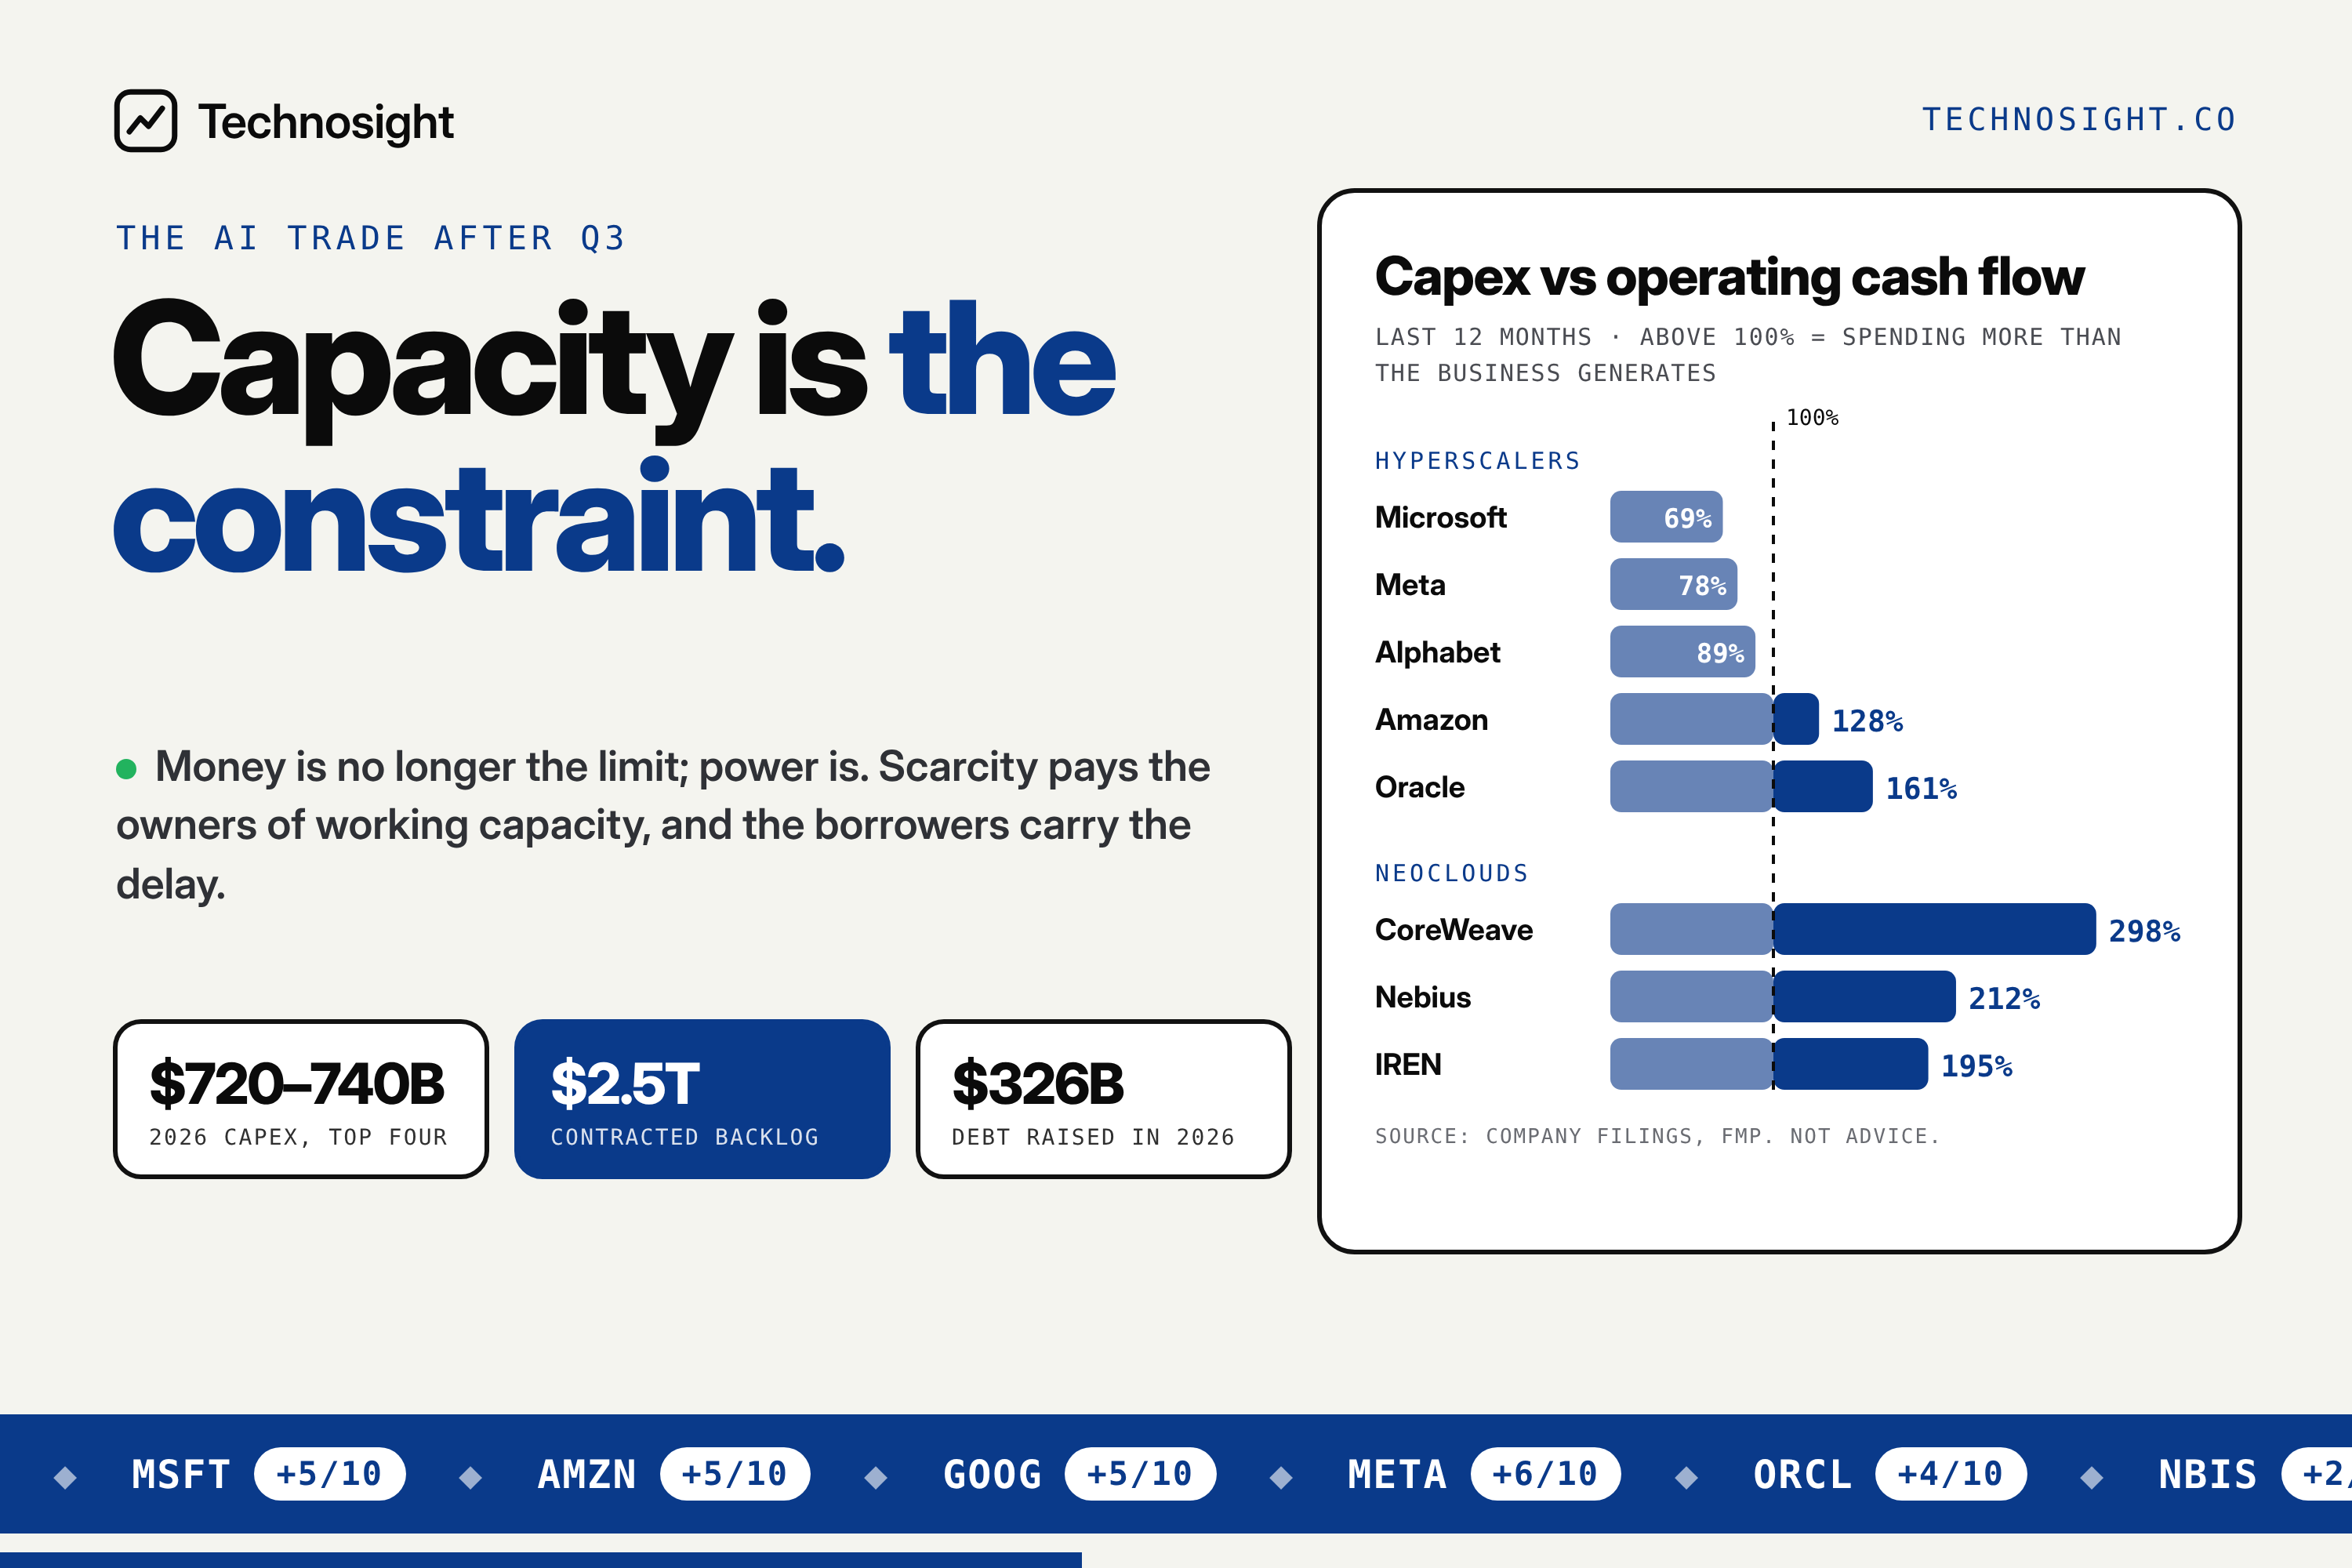
The four largest spenders will put $720–740B into AI in 2026 and have ~$1.8T of cloud backlog. What limits them now is power, permits and delivery. That moves value to whoever already owns capacity
Research series: Continuing the series about hyperscalers and adding neocloud review. Earlier research: Meta, Oct 22, 2026; Hyperscalers two-customers problem, Oct 9, 2026; Oracle, 9 Oct, 2026; Microsoft, 9 Oct 2026; Alphabet, 8 Oct 2026; Amazon, Oct 7, 2026. Scores for all ten stocks updated in our reports on https://technosight.co
Since the 28 October close, AI suppliers such as Lumentum, Astera Labs, SanDisk and Micron have fallen 18–33%, while Amazon and Microsoft rose 6% on 4 November alone. That split would make sense if AI spending were slowing. It isn’t: the five largest hyperscalers nearly doubled their capex over the past 12 months, and Alphabet, Amazon and Oracle have said they will spend more next year. What has changed is what limits the spending. Money is no longer the constraint; power, grid connections and, for some, financing are. This article looks at who gains when capacity is scarce: the hyperscalers that already own it and can fund it from cash flow, or the neoclouds that borrow to build it.
Spending is accelerating
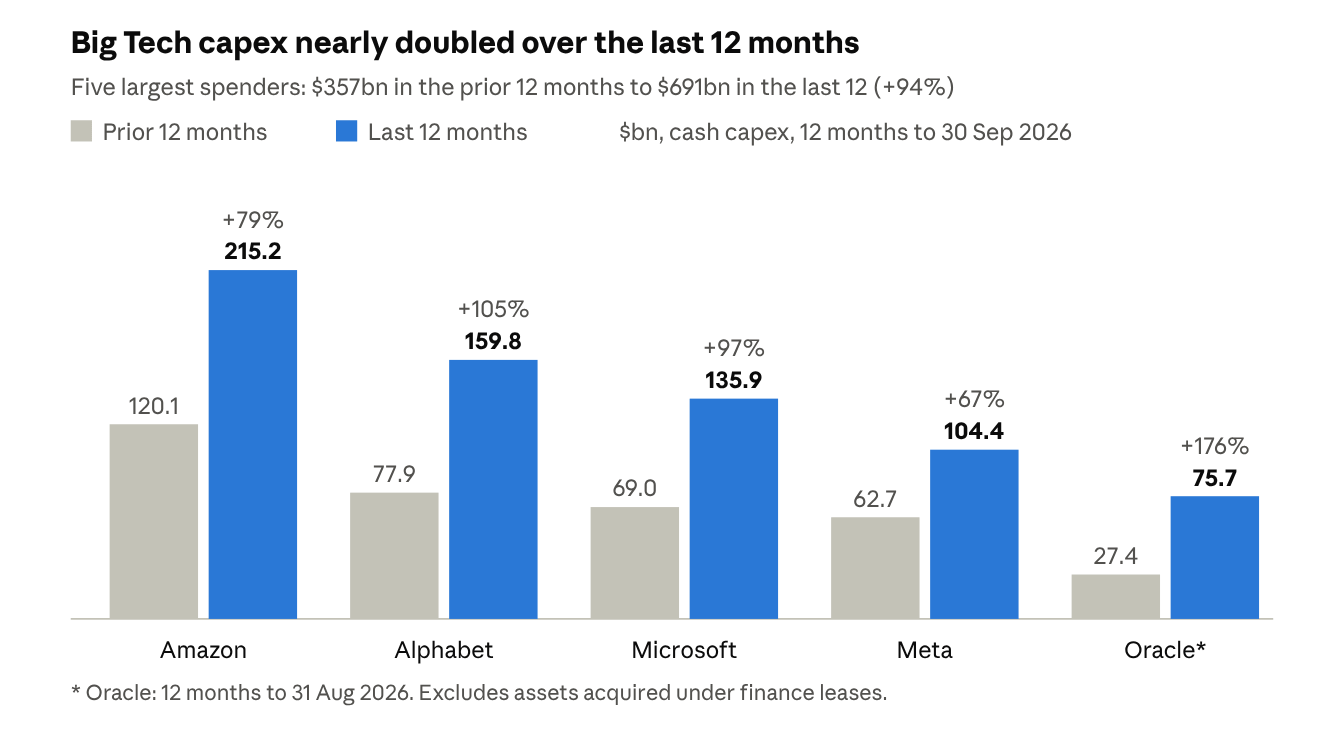
2026 guidance held or rose: Amazon ~$220B, Alphabet $195–205B, Microsoft ~$170B (calendar 2026), Meta $135–145B (floor raised $5B). Combined $720–740B. Oracle spent $55.7B in fiscal 2026 (to May), up 162%.
2027 will be higher. Alphabet CFO Anat Ashkenazi: “We continue to expect our CapEx to increase significantly in 2027.” Amazon: “meaningfully more” than 2026. Microsoft and Meta gave no number.
Demand is ahead of supply. Azure +48% to $33.2B; AWS +39% to $46.0B; Google Cloud $30.7B. Contracted backlog: Microsoft $677B (+73%), Oracle $664B (August quarter; only about 13% due in the next 12 months, per its 10-Q), Amazon $578B, Alphabet $561B: ~$2.48T together. Amy Hood: “We still have demand that exceeds supply.”
Yet the AI trade has reversed. Since the 28 October close: LITE −33%, ALAB and SNDK −26%, NBIS −21%, MU −18%, ORCL −12%. On 4 November AI builders fell another 10–20% while Amazon and Microsoft rose 6%.
Record spending and falling supplier shares can both be true only if investors doubt that the money turns into working capacity on time, or doubt who will pay for it. Those are the two complications.
Money is there, but power isn’t
The plans are slipping for lack of power, not chips or money. Microsoft trimmed its calendar-2026 capex to ~$170B from ~$175B because capacity from third-party providers arrived late.
Alphabet began renting third-party compute at the end of Q3 to cope with “acute capacity constraints”.
Amazon’s Andy Jassy: “2027 is largely sold out… A good chunk of 2028 is sold out”, and “I don’t think that shortage ends in 2027.” Reports say Amazon bought Nvidia GB300 racks faster than it could connect them to power.
Grid connections take years; chips take months. That mismatch is now killing projects, not just delaying them:
Microsoft and Nscale, UK (19 October). Microsoft pulled out of anchoring Nscale’s 50 MW site in Loughton, Essex (23,040 GB300 GPUs). Grid officials told Nscale they did not expect to supply power until the 2030s; the site was due to open in early 2027. Microsoft: “This decision relates to a single site.” UK grid queues have delayed some data-centre projects by up to 13 years.
Grid queues in the US. ERCOT’s connection queue reached ~474 GW in mid-2026, about 90% of it data centres.
Forecasts are already failing. PJM’s independent market monitor: 42% of the data-centre demand growth PJM forecast for 2026/27 to 2028/29 (about 4.0 GW) has been delayed or cancelled (FERC filing, 25 September). In June, JPMorgan said “over 60% of planned data center capacity for next year is not under construction”.
Local opposition. Data Center Watch counted at least 45 projects worth ~$68B disrupted in Q2 2026. A September UMass poll found nearly two-thirds of Americans oppose AI data centres near them. Texas, which holds ~27% of planned US capacity, paused new approvals in September, and its new governor wants the pause kept. Jefferies sees 13.3 GW of announced Texas projects at risk.
The election widens the pauses. Goldman Sachs: Democratic wins could trigger “temporary construction moratoria” covering 45% of planned US capacity, though it expects pauses to be short-lived. Newly elected governors in Texas, Georgia and Ohio have all called for moratoriums; New York paused approvals in July. In the NBC News exit poll, 76% of voters opposed a new data centre in their community.
What still gets built. GLJ Research’s Gordon Johnson: “Projects with power, permits and steel keep going.” Projects with power but no state permits could slip 12–18 months. Bank of America’s Stephen Juneau: “We do not expect these policies to derail the AI buildout, but they could make it slower and more expensive.”
Why it matters. Realised capex is now set by construction speed and grid timelines, not budgets. The spending still happens, but later and in a different mix: more on power, on sites that already have a connection, and on upgrading existing data centres; less on new greenfield builds.
The headline capex number is a ceiling, not a forecast. Owners of connected capacity gain pricing power. Anyone who has to build new capacity, or rent it from someone who does, carries the delay.
Spending now runs on borrowed money
Capex is overtaking cash flow, company by company. In the September quarter four of the five spent more than they generated: Amazon (capex $77.3B against operating cash flow of $42.4B, FCF −$34.8B), Alphabet (−$9.1B, its second negative quarter), Oracle (−$5.4B) and Meta (−$1.2B). Only Microsoft stayed positive (+$18.6B), with operating cash flow up from $36B to $58B in three quarters; Amy Hood says it will stay FCF-positive in fiscal 2027.
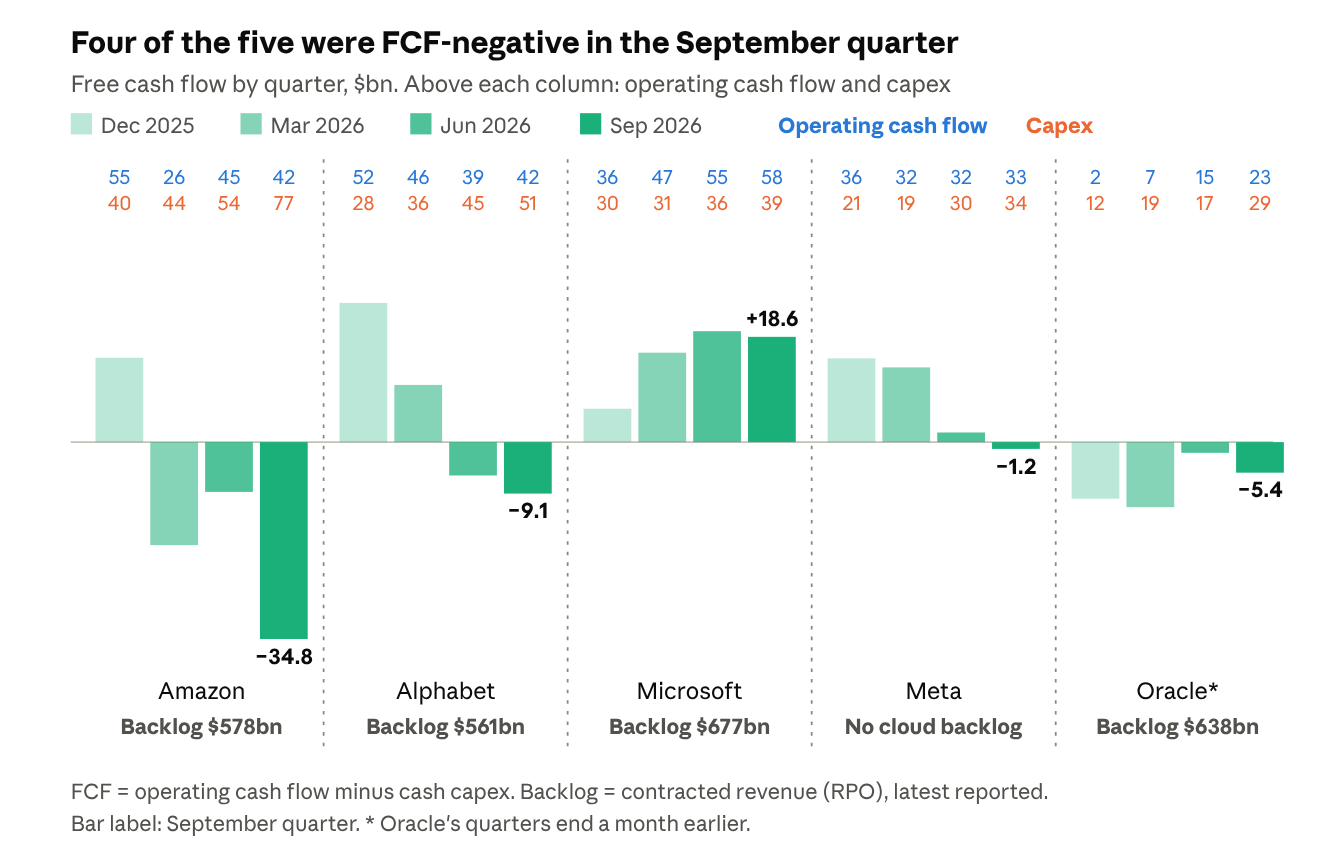
Backlog and cash tell different stories. Oracle has the most contracted revenue for each dollar it spends (backlog 8.8 times its 12-month capex) and the weakest cash flow. Microsoft has both: backlog 5.0 times capex and rising cash. Amazon spends the most against the least backlog cover (2.7 times). Meta has no backlog at all.
Microsoft: the only one funding the build from rising cash. Operating cash flow rose from $35.8B to $58.0B in three quarters on “strong cloud billing and collections”, faster than capex. Even so, it borrowed $25B on 29 October, its first bond sale since 2017, on top of the leases it already uses (Amy Hood, CFO: Microsoft has “lots of options to be able to tap the financing markets when they make sense and they’re attractive”). It borrows because it can do so cheaply, not because it has to: the 40-year tranche priced only 1.05 points over Treasuries, with orders 4.6 times the deal size. The watch points: backlog was flat on the quarter ($678B to $677B), OpenAI provides about 30% of Azure revenue, and Microsoft Cloud gross margin fell to 66% as Azure grows.
Amazon: the largest spender with the thinnest cover. September-quarter capex of $77.3B was almost twice operating cash flow of $42.4B. The spending is earning at AWS: operating income rose 55% to $17.8B (a ~39% margin), and Trainium commitments rose more than 20 times. But AWS can no longer fund the build alone, so Amazon now borrows: at least $25B of bonds.
Alphabet: negative partly for one-offs. The −$9.1B includes a European Commission fine of about $5.2B and a $3.2B inventory build for TPU systems that management says are “tied to contracted deals”. Without them, operating cash flow (about $50.7B) roughly matches capex. Its backlog converts fastest: more than 55% of the $561B should become revenue within 24 months. The risks are search, where ad growth slowed to 12%, and Q4, where guidance implies capex of $63–73B.
Meta: spending without a backlog. Operating cash flow has been flat at $32–36B a quarter while capex rose from $21B to $34B, and there is no contracted revenue behind it. The gap is being filled with equity: a $37.5B sale ($12.5B of 6.5% mandatory convertible preferred and $25B of common) plus a planned $60B at-the-market programme. Revenue from its Muse AI agent starts only in 2027. Meta’s own FCF figure, which deducts finance-lease payments, was −$2.1B.
Oracle: backlog-rich, cash-poor. Backlog rose to $664B in the August quarter, but roughly half is tied to OpenAI. Operating cash flow jumped from $2.1B to $23.1B, “inflated by customer prepayments”; FCF was still −$5.4B. Debt is $125B, interest expense rose 55% to $1.4B a quarter, and it has sold $20B of shares. Fiscal-2027 capex is guided at $90–95B. CFO Hilary Maxson says new AI contracts “will not require incremental capital from Oracle” because customers prepay or bring their own hardware.
Who is already over the line. Over 12 months, Amazon (capex 128% of operating cash flow) and Oracle (161%) already spend more than their operations generate. Alphabet (89%) and Meta (78%) are close enough that another year of rising capex takes them over. Microsoft (69%) has the most room.
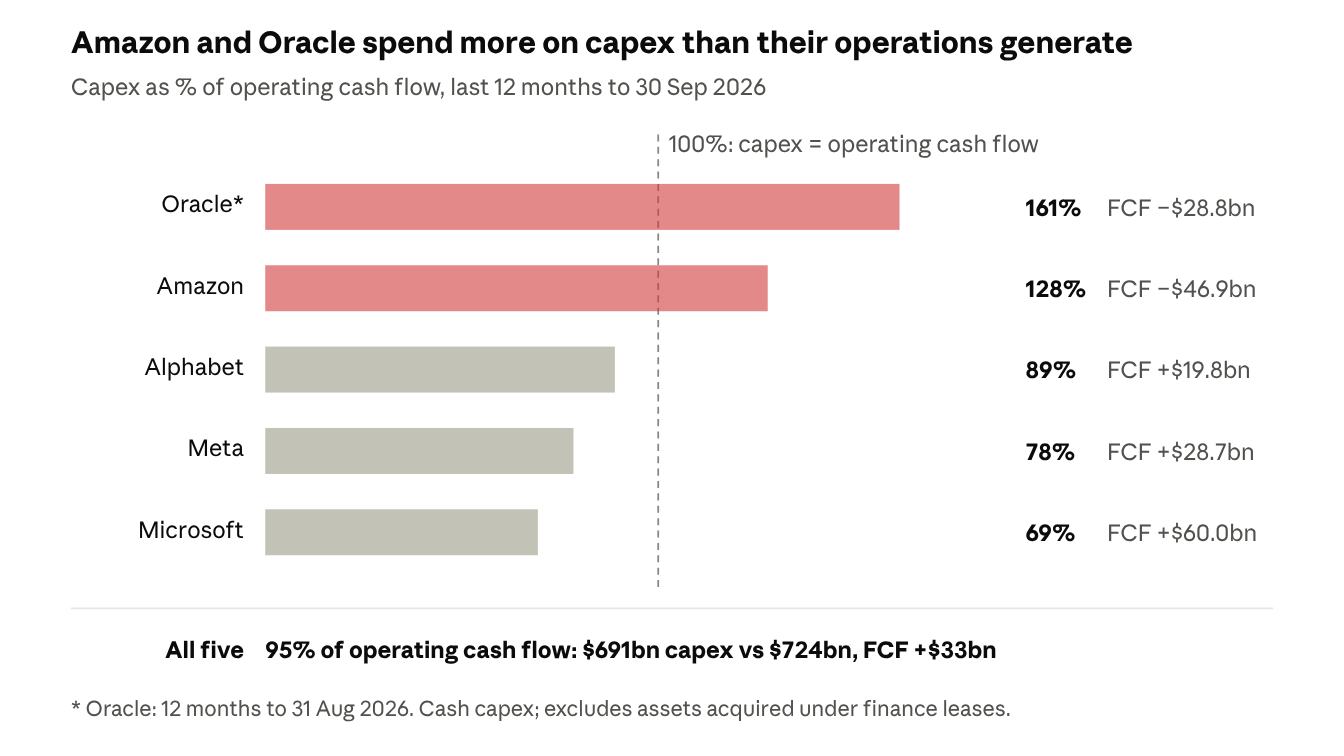
So the gap is being borrowed. S&P Global Market Intelligence: Microsoft, Alphabet, Amazon, Meta and Oracle raised $326B of debt in 2026, triple last year.
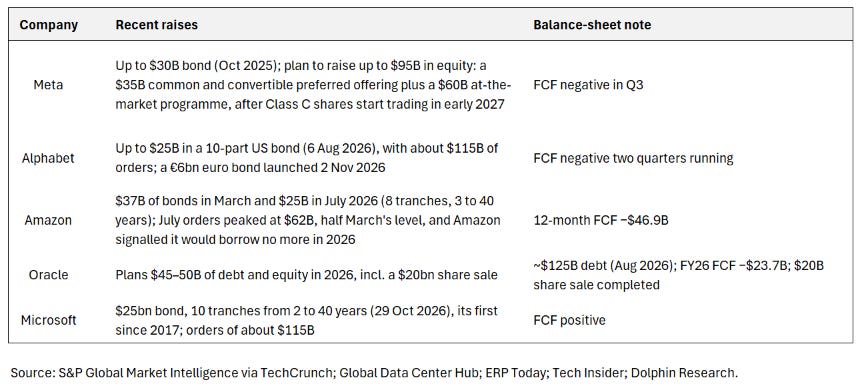
More sits off the balance sheet. Goldman Sachs (3 Nov): the five hyperscalers have ~$3.2T of commitments not on their balance sheets: ~$1.3T of leases not yet started and ~$1.9T of purchase commitments, $685B of it due by end-2027. Goldman’s Amanda Lynam calls this “an additional ‘use of cash.’”
And the kit wears out fast. About 65% of Alphabet’s Q3 infrastructure spend and ~75% of Microsoft’s capex went on short-lived servers and networking. Alphabet’s depreciation rose ~49% year on year. Each year’s spending has to earn its return within a few years. It is already showing in earnings: over the last 12 months, depreciation and amortisation grew faster than revenue at all five: Oracle (+67% vs +22%), Alphabet (+45% vs +22%), Meta (+41% vs +28%), Microsoft (+37% vs +18%) and Amazon (+28% vs +15%). Oracle’s D&A has risen from 11.0% to 15.2% of revenue, Microsoft’s from 10.5% to 12.2%.
Why it matters. Spending funded from operations can continue through a slowdown; spending funded by bond and equity markets depends on those markets staying open. That splits the five: Microsoft funds its build from cash flow, Alphabet and Meta are at the edge, and Amazon and Oracle now rely on raising money.
So what: investors are separating AI spenders that fund capacity from cash flow from those that borrow for it. The first group can wait out the power delays; the second pays interest while it waits.
Scarcity pays the owners of working capacity
The test for each spender: does it own capacity that is already powered, can it rent that capacity out, and does it fund new capacity from cash flow?
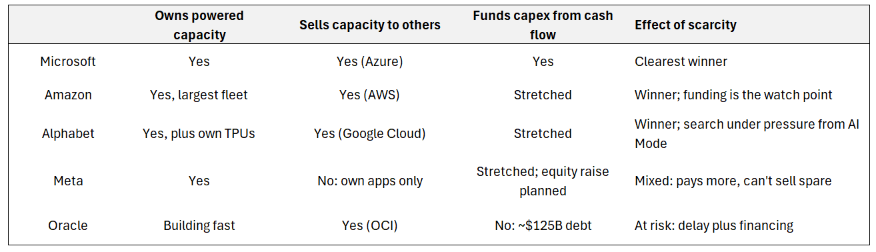
Microsoft. Azure revenue grew 48% in the September quarter, ahead of the 44–45% guide, and Microsoft guided 49–50% for December. Backlog is $677B. Its delays come from third-party suppliers, not demand. Hood: “each dollar of capex has the potential to support more revenue and higher returns over time.” Depreciation is already showing in gross margin, which fell to 67.8% from 69.0% a year earlier as D&A rose 37% over 12 months against revenue growth of 18%. Operating margin still rose, to 49.8% from 48.9%, because other costs grew more slowly than revenue. Cash is where the spending shows most: capex doubled to $39.4B in the quarter, and free cash flow fell from $25.7B to $18.6B, still positive, unlike Amazon’s, Alphabet’s and Oracle’s.
Amazon. AWS +39%, $578B backlog, “accelerating for the sixth straight quarter”. Jassy on the call: “almost as fast as we install capacity, customers are gobbling it up.” The question is funding: $220B of capex against negative 12-month FCF and at least $25B of new bonds. Jassy: “We can fund this plan.” Total debt has doubled in a year, from $135B to $272B, and quarterly interest expense has tripled, from $538M to $1.7B.
Alphabet. Google Cloud $30.7B (+103%), with operating margin up from 23.7% to 36.2%, backlog $561B, and its own TPUs give it a second source of chips. It is already renting third-party compute, a sign of scarcity. Against that, search ad growth slowed to 12% and the stock had its worst day on record after Q3 (−12%).
Meta. A top GPU buyer that also designs its own AI chips (ASICs), but with no cloud to rent out, so scarcity raises its costs without raising its prices. Ad revenue grew 26% in Q3, but capex still ran ahead of operating cash flow: Q3 free cash flow was −$1.2B. Susan Li gave no 2027 capex figure: “We aren’t providing a specific outlook for 2027 capex at this time.” Meta has already answered how it will close the gap: with shares. On 27 Oct it announced a $37.5B offering ($25B of common stock and $12.5B of mandatory convertible preferred) and said it may raise up to $97.5B in stock. At $630, the common stock alone is about 1.5% of the share count, and the full $97.5B about 6%. S&P moved its outlook to negative on 30 Oct. The ads are paying for the business; the AI build now also needs new shareholders.
Oracle. The most leveraged of the five: $664B of backlog, more than half reportedly from OpenAI (Bank of America), and only about 13% of it due in the next 12 months. Debt is about $125B and FY26 free cash flow was −$23.7B. The August quarter (Q1 FY27) showed how it pays for the build: revenue rose 30% to $19.3B, operating cash flow jumped to $23.1B on customer prepayments, and free cash flow was still −$5.4B. Interest now costs $1.4B a quarter. At its 28 Oct investor day Oracle capped new capital-market funding at $20B through FY30, then raised all of it on 2 Nov: $10B of stock at $116 and $10B of notes. Scarcity pays Oracle only as fast as customers prepay and investors lend; it has no cash cushion of its own.
So what: the market is right to favour the cash-funded cloud owners. Within the five, scarcity helps most where capacity can be sold (MSFT, AMZN, GOOG) and least where it is only consumed (META) or still has to be financed (ORCL).
Neoclouds versus hyperscalers
Neocloud is a company that builds or leases data centres and rents GPU capacity, mostly to the hyperscalers and AI labs. Microsoft’s “third-party providers” are largely neoclouds.
Why scarcity should help them, and why it doesn’t. When hyperscalers run short, they lease neocloud capacity, so demand is there: Nscale says its contracted value grew from $100M to more than $103B in two and a half years. But the neocloud carries the two risks the hyperscaler avoids. It must secure power, and it must borrow to build. The customer keeps the option to walk: Microsoft dropped Nscale’s Loughton site when power slipped to the 2030s, and called it “a single site”. The hyperscaler rents the upside; the neocloud owns the delay.
The cash gap is far wider than at the hyperscalers. The hyperscalers’ 12-month capex ran at 69–161% of operating cash flow. CoreWeave’s ran at 298%, Nebius’s 212% and IREN’s 195%; Applied Digital’s operating cash flow was close to zero and TeraWulf’s was negative. Where operating cash flow is positive, much of it is customers paying in advance.
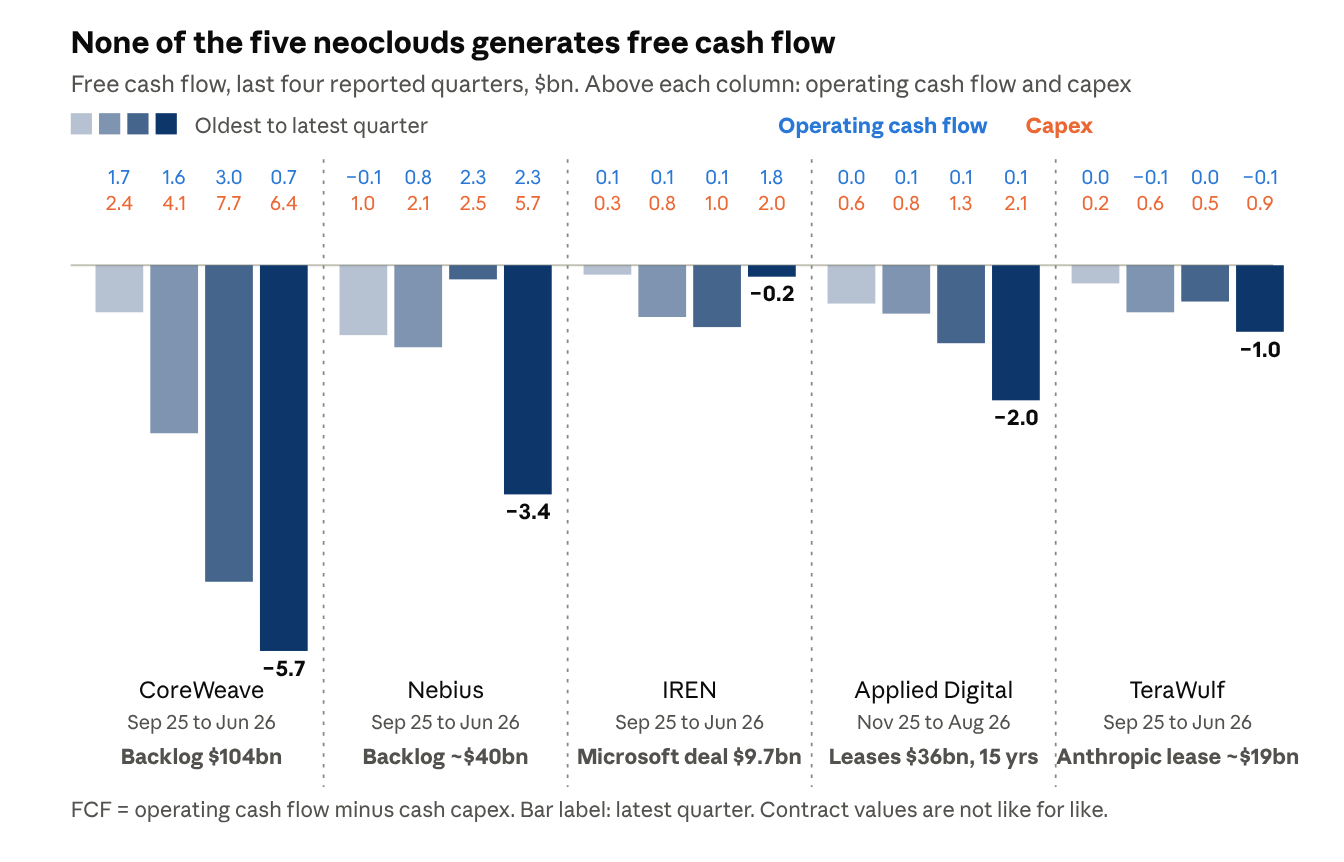
CoreWeave: funded by debt, and the interest bill is rising. Capex rose from $2.4B to $7.7B a quarter, while operating cash flow fell to $0.7B in the June quarter, leaving FCF of −$5.7B, covered by $10.1B of new financing. Interest expense went from $267M to $640M a quarter and is guided to $860–940M, while operating income was −$49M. The $104B backlog is large, but each quarter’s interest bill has to be paid before that backlog turns into cash.
Nebius: funded by customers. Operating cash flow jumped to about $2.3B a quarter because ~70% of Q2 deals came with prepayments covering 50–60% of the capex behind them. Capex still doubled to $5.7B in the June quarter, and 2026 is guided at $20–25B. It has the strongest balance sheet ($8.0B of cash against $8.5B of debt) and sold $2.8B of shares in Q2.
IREN: one prepayment, a much bigger plan. The jump to $1.81B of operating cash flow in the June quarter was almost all deferred revenue ($1.72B), largely from its $9.7B Microsoft contract. Fiscal-2027 capex is guided at $25–30B, six to seven times the $4.1B it spent last year, against about $14B of funding lined up. It reports on 5 November.
Applied Digital: the landlord waiting for power. Operating cash flow of $0.06B against capex of $2.07B in the August quarter. Only 250 of its 1,410 leased MW are live, all for CoreWeave; none of the 1,010 MW leased to investment-grade hyperscalers is live yet. Its $36B of lease value starts paying only when each site is energised.
TeraWulf: strong tenants, cash still going out. Operating cash flow was negative in all four quarters. Its customers are strong (Fluidstack with $600M of Google credit support; Anthropic on a ~$19B, 20-year Kentucky lease), but the Kentucky rent starts in 2H 2027 and $1.1B of its $2.1B convertibles is short-term.
So what: the neoclouds are where the capacity shortage turns into financing risk. Their customers can wait for a delayed site; they cannot, because the debt and the interest are already running. Musk (2 Nov): “debt markets have almost entirely shut off access to money for any company that doesn’t have substantial revenue”; he expects “death and consolidation” among the 200+ neoclouds.
Balance sheets (30 June 2026 unless stated; debt excludes leases):
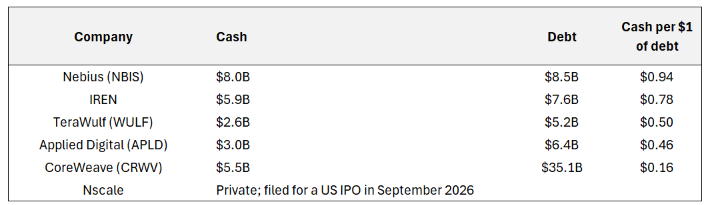
Cost of capital decides who survives. Hyperscalers borrow at investment-grade rates; CoreWeave’s unsecured coupons rose to 9.75% and its 2032 notes yield ~15%. GPU-secured loans are cheaper (CoreWeave priced one under 6% in March), so the collateral and the customer contract matter as much as the company.
Power secured decides the rest. On 4 November Riot rose 11% on existing Texas power approvals while Cipher fell 17%. Cantor: the result “materially increases the likelihood that Cipher’s next data-center lease will be signed outside Texas.”
The test for each neocloud: MW energised, share of revenue from one customer, contract length versus debt maturity, and cost of debt.
So what: most neoclouds are a leveraged bet on hyperscaler overflow demand. Prefer the hyperscalers for the scarcity theme; within neoclouds, only those with energised power, investment-grade customers and cash close to their debt (Nebius on these numbers) are candidates.
Power is where the next dollar goes
Why the mix shifts. If power is the bottleneck, each extra dollar of capex is worth more spent on power than on chips that would sit idle. In March, Amazon, Google, Meta, Microsoft, OpenAI, Oracle and xAI pledged to supply their own power and fund transmission, so part of their capex is turning into energy capex.
Three ways the hyperscalers get power:
Sites that already have a grid connection. Scarce, so they command a premium: the reason Riot rose on 4 November.
On-site generation. Gas turbines and engines next to the data centre, bypassing the grid queue.
Long-term supply contracts with utilities and generators, plus paying for grid upgrades themselves.
Who benefits:
Gas turbine and grid equipment makers. GE Vernova’s gas backlog and slot reservations rose from 116 GW to 122 GW in Q3, Power orders rose 178% to $21.8B, and total backlog reached $197B. CEO Scott Strazik: “We now expect our backlog to exceed $200 billion in the fourth quarter, with improved margins.” Eaton’s Electrical backlog is up 46% in a year (Electrical Global +121%), at a record 25.3% segment margin.
Utilities that can bill data centres for the upgrades. AEP raised its five-year capital plan to $100B through 2031, from $78B in May, and expects 84 GW of new contracted load by 2031. Take-or-pay agreements with large customers are expected to cover up to $21B of fixed costs that households would otherwise pay.
Gas producers. EQT signed a 10-year deal to supply 325,000 Dth a day to the CPV Shay power plant in West Virginia, priced off PJM power markets rather than a gas index, and counts more than 45 Appalachian demand projects totalling nearly 20 Bcf a day. Mach Natural Resources (MNR), covered in our income article, is the yield way into the same demand.
Owners of connected sites. Capacity that already has power is what the hyperscalers rent from IREN, Applied Digital and TeraWulf (section 5); TeraWulf’s Anthropic leases are now backstopped by Google.
The political limit. Voters blame data centres for rising bills. Regulators can make data centres pay more for power and connections, which raises the cost of every new site and favours capacity that is already built.
So what: power turns the AI trade from a chip story into an infrastructure story. That’s a further reason scarcity persists into 2027, and a further advantage for whoever already owns powered capacity.
Scores and signposts
Scores are from our new market-intelligence reports of 4 Nov (refreshes for the five hyperscalers, new reports for the five neoclouds, https://technosight.co). Prices, EMAs, valuation and support levels are from FMP after the 4 Nov close. EV/EBITDA is trailing 12 months, with the 3-year median in brackets.
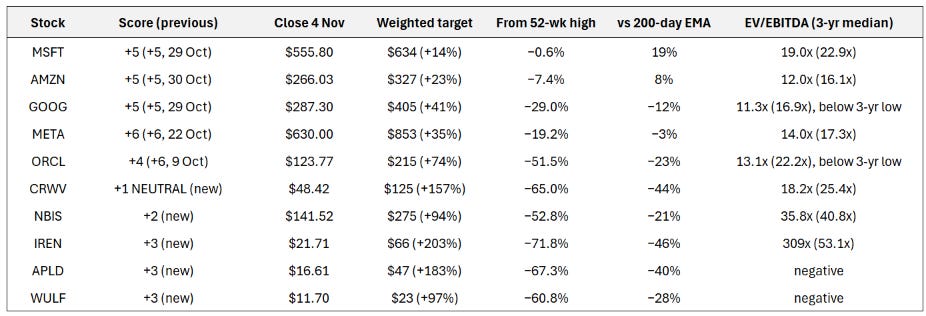
What the scores say:
Microsoft, Amazon and Alphabet hold at +5 through the sell-off, and their zones worked. Microsoft touched its $505–520 zone on 2 Nov, then rose 9.6% in two sessions to a record on 2.3 times normal volume. Amazon filled its zone at $229 on 30 Oct and is 16% higher. Alphabet held its March base at $272.
Meta held at +6, the highest in the set, but for a different reason: it fell 13% after announcing a $37.5B share and convertible sale on 27 Oct, and said it may raise up to $97.5B in stock. S&P moved its outlook to negative. The targets did not move, so the gap to them widened to 35%.
Oracle drops from +6 (9 Oct) to +4. Analysts (90% Buy, target 74% above the price), call-leaning options and a PEG of 0.53 on Oracle’s own FY30 target keep it positive. Against it: a −7.7% free-cash-flow yield, capex at 105% of revenue (three times the hyperscaler average), and a $20B share and bond sale on 2 Nov, $10B of stock at $116, below the old $133–136 buy zone.
The neoclouds score +1 to +3, and the points come from analysts and options, not the business. Targets sit 94–203% above the price, while free-cash-flow yields run from −17% (Nebius) to −89% (Applied Digital). IREN, Applied Digital and TeraWulf reach +3 on call-heavy options; IREN, TeraWulf and CoreWeave also score a squeeze set-up (short interest 24–31% of float, implied-volatility rank 77–93%) going into results. Four of the five report within eight days, and each report needs a refresh after its results.
What the valuation data says:
The cheapest against their own history are Alphabet and Oracle, both below their 3-year EV/EBITDA lows (11.3x against 12.7x; 13.1x against 14.9x). Meta and Amazon sit near the bottom of their ranges. Microsoft is the exception: at a record and 19% above its 200-day EMA.
On forward earnings (FY27 consensus): Oracle 15.2x (11.2x on FY28), Meta 18.5x, Alphabet 19.1x, Amazon 24.6x, Microsoft 27.7x. Consensus puts Amazon’s and Alphabet’s FY26 EPS above FY27, most likely gains on AI-lab stakes, so FY27 is the cleaner base.
The neoclouds are 53–72% below their 52-week highs and all trade below their 200-day EMAs. Four of the five lose money, and diluted shares are up 13% at CoreWeave, 14% at Applied Digital and 26% at TeraWulf in a year. Net debt: CoreWeave $45B; Applied Digital $3.5B; TeraWulf $2.6B; Nebius $2.0B; IREN $1.9B.
So what: the dip is deepest where the cloud numbers are strongest (Alphabet) and where the balance sheet carries the most risk (Oracle). Meta is the middle case, now carrying the dilution of its share sale. The scores back Alphabet (+5, base held) more than Oracle (+4, down from +6): cheap on EV/EBITDA, but with negative free cash flow and new shares to absorb. For the neoclouds, this week’s results decide whether the sell-off is a price or a warning.
Putting it together
The spending is not the problem: Alphabet, Amazon and Oracle will spend more in 2027, and about $2.5T of contracted backlog says customers want the capacity. Power is the constraint, and it decides who gains:
Cash-funded owners gain most. Microsoft funds its build from operations, but there is no dip to buy: it closed at a record, 19% above its 200-day EMA, and its buy zone is the $540–552 breakout retest. Amazon’s AWS is accelerating and the stock has broken its downtrend, but it now borrows (zone $253–260). Alphabet has the fastest-growing cloud (+103%) at the bottom of its 3-year valuation range, and its March base held (zone $272–282, out below $271.5).
Capacity consumers and borrowers pay for the delay. Meta scores highest (+6) on its ad business but is issuing shares to fund the build (zone $600–612). Oracle has the most backlog per dollar of capex and the weakest cash flow, and sold $10B of stock at $116 (watch $116–122.5).
Neoclouds carry the financing risk. Their scores (+1 to +3) rest on analysts and options, and four report by 12 Nov. On today’s numbers only Nebius, with customer prepayments and cash close to its debt, passes the test.
Power suppliers collect either way: turbine and grid makers, utilities that bill data centres for upgrades, and gas producers.
The signposts below show when this changes
Q4 calls in late January: Alphabet’s 2027 capex figure; whether Microsoft and Meta give one.
Microsoft’s delayed third-party capacity coming online in the second half of fiscal 2027.
Scarcity gauges: GPU rental prices, cloud price changes, cloud operating margins.
Funding: Meta’s equity programme, Oracle’s raise, CoreWeave bond prices, Nscale’s IPO.
Power: grid connection approvals, Texas rules, the hyperscalers’ own-power projects.
Nvidia’s results in the second half of November.
What would prove us wrong:
Backlog growth slows or contracts are cancelled: demand, not capacity, becomes the limit.
GPU rental prices fall: capacity is no longer scarce.
A cash-funded spender (Microsoft, Amazon or Alphabet) cuts capex, not just the leveraged ones.
This research is for information, not advice
Backtesting
Explore all company fundamental valuations, DCF intrinsic models, and thematic deep-dives in Backtesting.
Quantitative Models
Automated daily equity screening across 6 quantitative factor models with 15-minute EMA regime confirmation.
More Research from the Desk
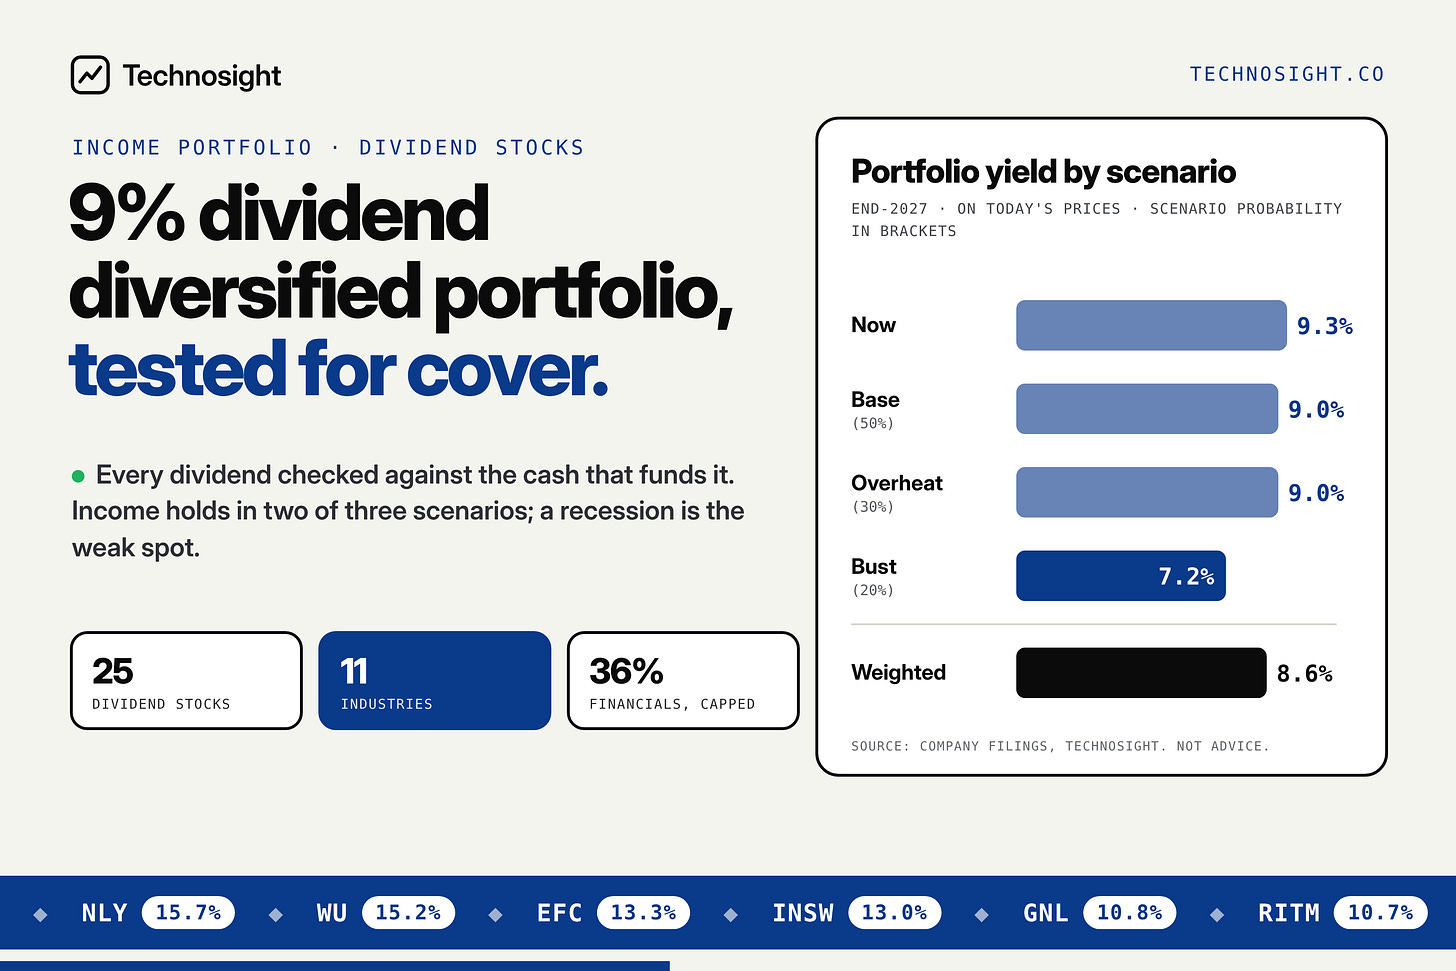
9% dividend diversified portfolio, tested for cover
Our dividend stocks pass the cover test that fits its business: distributable earnings for lenders, AFFO for landlords, free cash flow for operating companies. Financials pay the most but share one risk, the credit cycle, so they are held to 36%. Two dividends were cut this quarter, Blackstone Mortgage Trust’s to $0.30 and Telefónica’s by half, and both count at the new rate. In our end-2027 scenarios, income holds at about 9.0% in Base and Overheat, which carry 80% of the weight, and falls to about 7.2% in Bust as tanker, oil and thinly covered payers cut. Where share prices go nowhere, the dividends still pay about 9%. In a recession, the bonds have to carry more of the load.
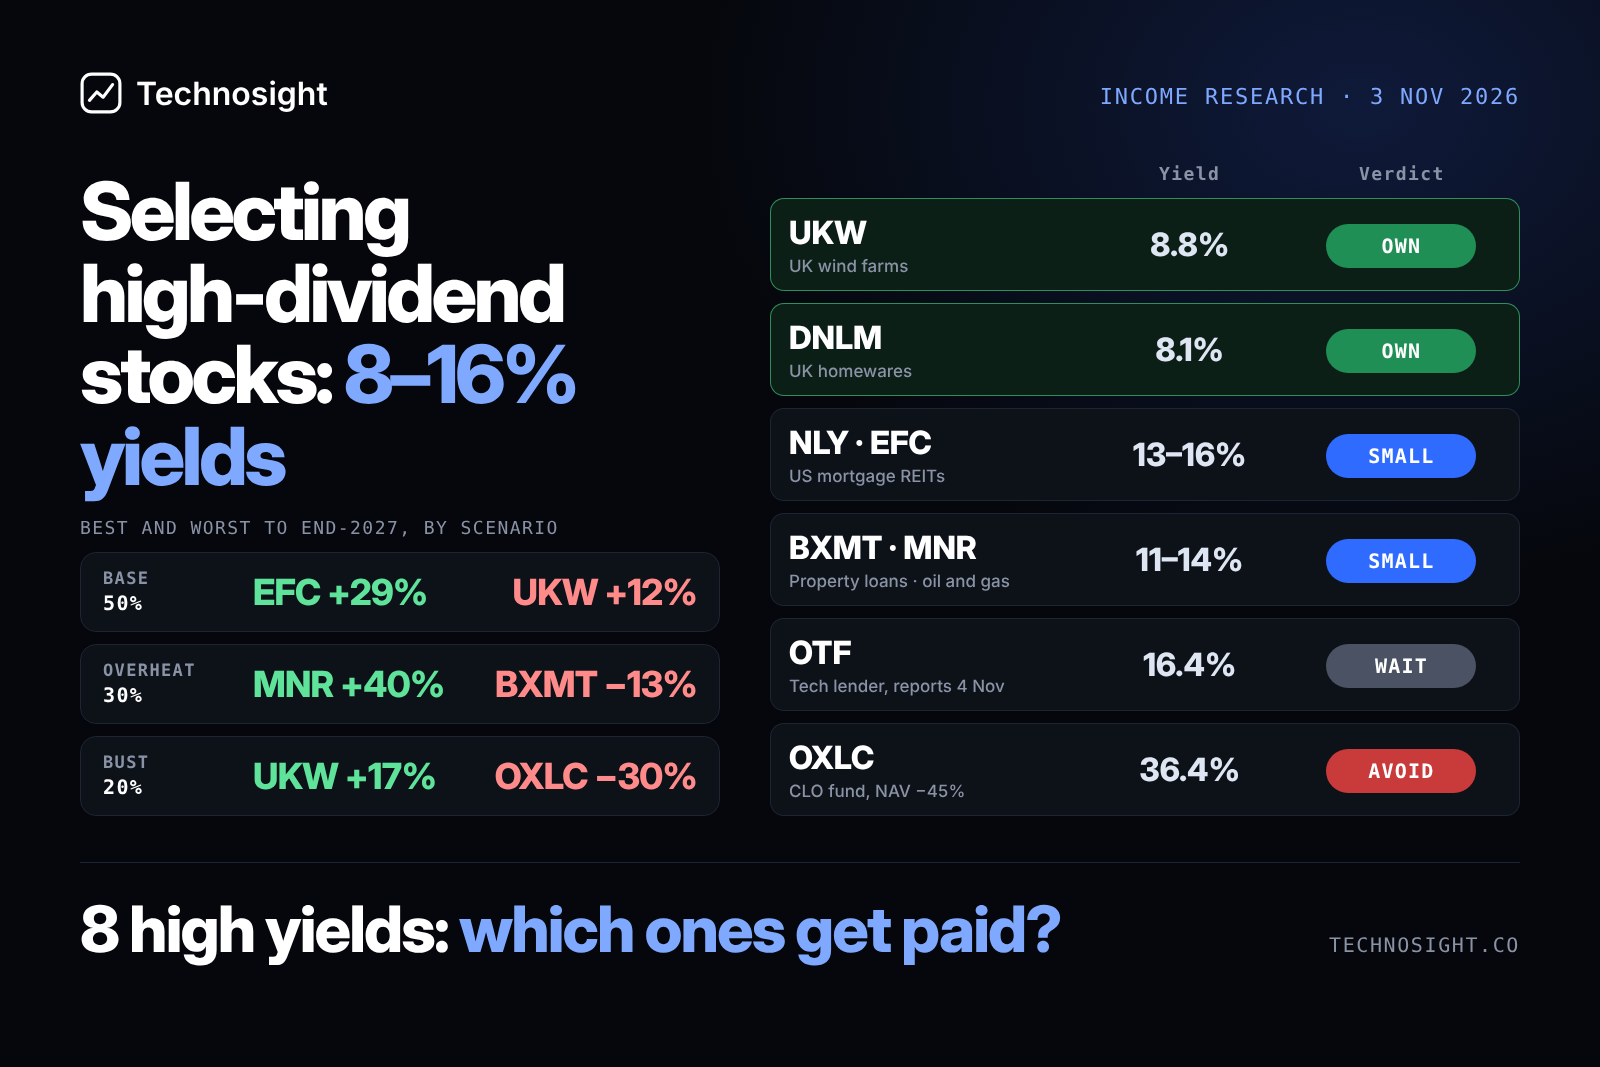
High-dividend stocks: which yields are real?
We tested eight high-dividend stocks against our three end-2027 scenarios to find stocks where you can plan on is 8% to 16% dividend yield: Greencoat UK Wind (8.8%) and Dunelm (8.1% including its special) as core income. Own small: Annaly (15.7%), Ellington Financial (9%, monthly), Blackstone Mortgage Trust (10.9% after its cut) and Mach Natural Resources (13.9%, variable) as an energy hedge. Wait: Blue Owl Technology Finance (16.4%), until results on 4 November show whether it cuts. Leveraged US lenders or credit funds lose in our Overheat scenario, where oil stays near $100 and the Fed raises rates to 4.75–5.00%. They borrow to hold loans and bonds, so higher rates raise their funding costs and cut the value of what they hold. They add income, but not protection. Keep them to a small position, and let the inflation-linked gilts, the UK holdings (UKW and DNLM) and MNR’s energy exposure do the hedging.