
High-dividend stocks: which yields are real?
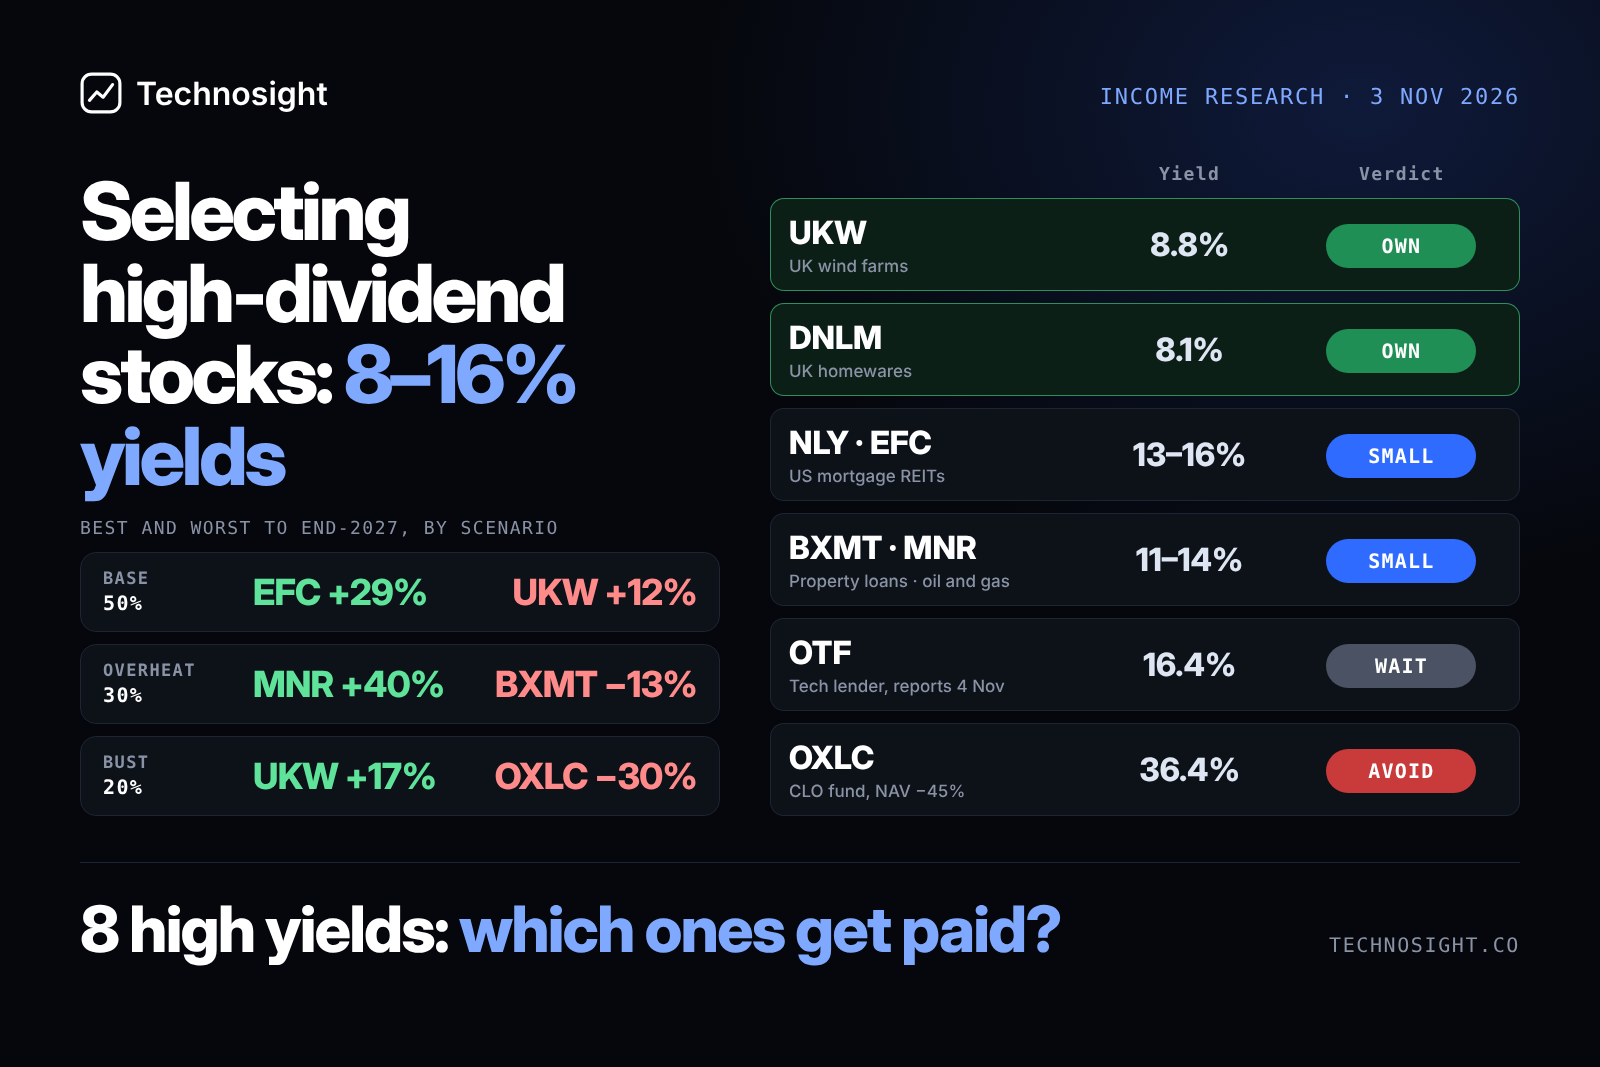
We tested eight high-dividend stocks against our three end-2027 scenarios to find stocks where you can plan on is 8% to 16% dividend yield: Greencoat UK Wind (8.8%) and Dunelm (8.1% including its special) as core income. Own small: Annaly (15.7%), Ellington Financial (9%, monthly), Blackstone Mortgage Trust (10.9% after its cut) and Mach Natural Resources (13.9%, variable) as an energy hedge. Wait: Blue Owl Technology Finance (16.4%), until results on 4 November show whether it cuts. Leveraged US lenders or credit funds lose in our Overheat scenario, where oil stays near $100 and the Fed raises rates to 4.75–5.00%. They borrow to hold loans and bonds, so higher rates raise their funding costs and cut the value of what they hold. They add income, but not protection. Keep them to a small position, and let the inflation-linked gilts, the UK holdings (UKW and DNLM) and MNR’s energy exposure do the hedging.
Trailing yields run from 8% to 36%. After cuts, specials and coverage, we would own six now, wait on one and avoid one.
Research series: research on building a portfolio from sovereign and corporate bonds, dividend stocks and growth stocks, held in a UK tax-free wrapper (SIPP or ISA). Earlier research:
De-risking a portfolio with gilts, dividend stocks and bonds for a modelled 6.6% a year (27 Oct 2026): the three-bucket income portfolio.
Where will the market be by end-2027 and what to own (31 Oct 2026): three scenarios, Base (50%), Overheat (30%) and Bust (20%), and the portfolio rules.
This article screens additional candidates for Bucket 2, dividend stocks, against the 3 scenarios described in the article above.
Introduction: what the screens miss
Our scenarios put the S&P 500 near 7,620 at end-2027, roughly flat, so income has to carry the portfolio. A screen for yields above 8% throws up names like the eight below. Most of those yields will not be paid at that rate over the next year.
We ran each stock through the analysis: what the business is, the TTM dividend, the right measure of cover, the balance sheet, the latest results, why the price moved, and returns to end-2027 in each scenario.
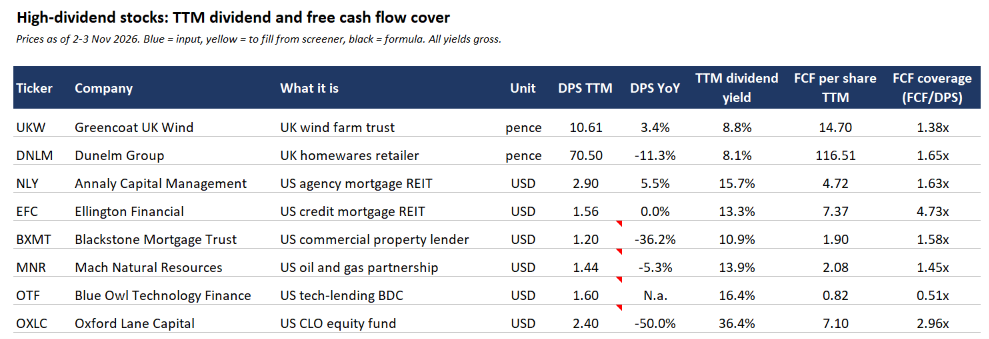
Prices as of 2–3 Nov 2026. All yields gross, before tax.
DPS = dividend per share. DPS TTM is forward-looking: a cut dividend counts at its new rate (BXMT $0.30 × 4, MNR $0.36 × 4, OXLC $0.20 × 12), and specials count if paid consistently over eight quarters (DNLM), or every quarter since listing (OTF). DPS YoY compares with the rate a year earlier on the same basis.
FCF per share = TTM free cash flow (screener) divided by shares outstanding. FCF coverage = FCF per share / DPS TTM. For lenders and funds (EFC, BXMT, OTF, OXLC), operating cash flow includes loan sales and repayments, so FCF coverage can mislead: EFC’s 4.73x reflects loans sold into securitizations, OXLC’s 2.96x reflects CLO sales, and OTF’s 0.51x reflects new loans funded. The company sections use the right measure for each business.
Four observations:
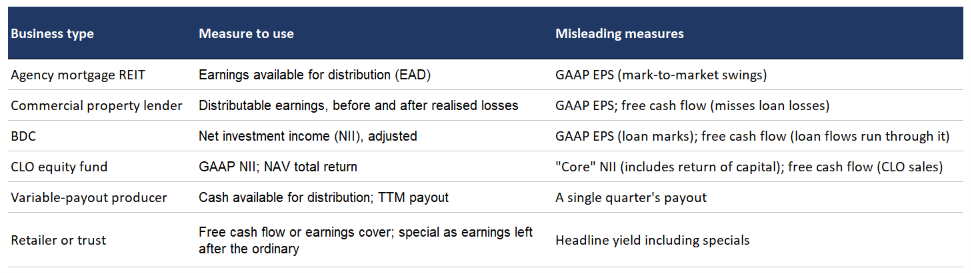
Each business needs its own measure of cover. For lenders, GAAP profit understates what can be paid (it subtracts non-cash marks), and free cash flow overstates it (it misses loan losses). We will use Earnings Available for Distribution (EAD) for NLY, adjusted distributable earnings for EFC, distributable earnings for BXMT, net investment income for OTF and OXLC, and cash available for distribution for MNR.
A share price below book value means investors expect more loan losses than the company has recorded. Book value is total shareholders’ equity: total assets minus total liabilities. In the screener tables it’s the “Total equity” line. BXMT trades at 0.65x book, OTF at 0.59x and OXLC at about 0.63x. By contrast, NLY trades at 1.04x, UKW at 0.90x and EFC at 0.86x.
The US credit names fall together. NLY, BXMT and OXLC lose in Overheat, where oil stays near $100 and the Fed raises rates to 4.75–5.00%. All three borrow to hold loans or bonds. Higher rates raise their funding costs, cut the market value of Annaly’s fixed-rate mortgage bonds, and push more of BXMT’s property borrowers and OXLC’s leveraged-loan borrowers into default. It is the same scenario in which fixed-rate gilts and retail bonds lose value, so these stocks add income but no protection. MNR is the only clear winner from higher energy prices. OTF’s floating-rate loans earn more as rates rise, which partly protects it.
Some payouts are not fixed. MNR pays out whatever cash is left each quarter after drilling and interest, so its distribution rises and falls with gas and oil prices. Dunelm pays its special dividend from profit left over after the ordinary dividend, so the special shrinks when profits stall. When planning income, assume the lower payout.
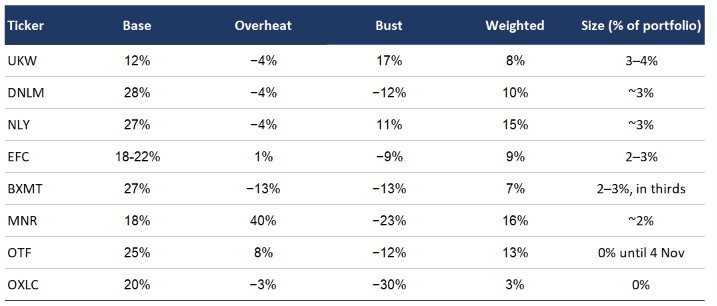
Scenario returns are our estimates of total return (price change plus dividends) from today’s price to end-2027. The weighted figure uses probabilities of the 3 scenarios as Base 50%, Overheat 30%, Bust 20%.
Greencoat UK Wind (UKW): 8.8% yield. Buy.
What it is. A London-listed investment trust that owns stakes in UK wind farms. It earns from selling power and from government subsidies (Renewables Obligation Certificates) indexed to inflation, and pays out most of that cash.
Dividend. TTM 10.6p, 8.8% at 120.4p. The 2026 target is 10.7p, “the thirteenth consecutive inflation linked increase”, now tied to CPI after the government switched subsidy indexation from RPI. H1 2026 cash cover was 1.9x (net cash generation £221.6m against £113.8m of dividends), helped by generation 4.9% above budget. H1 is the windier half, so full-year cover will be lower.
Balance sheet. NAV (net asset value) is 134.1p per share at 30 June vs price 101.6p (24% discount). Debt is £2,070m, 41.7% of gross assets, above the 40% limit for new borrowing. About 66% of revenue for the rest of 2026 is fixed-price.
Latest results. “The Company prioritises dividends,” and has made no disposals: “the absence of completed transactions reflects pricing discipline and selectivity.” The power price assumption drops from £79.80/MWh in 2026 to £62.71/MWh in 2027.
Why the price moved. Up about 20% from 97–102p in July to 120p. Higher power prices and strong H1 generation narrowed the discount to NAV from 24% to about 11%.
Weighted return: +8%
Returns in each scenario are in brackets below. Weights of scenarios are Base 50%, Overheat 30%, Bust 20%. Click to read the definitions.
Base (+12%): Gilt yields stable, power prices fade, NAV flat, discount ~10%.
Overheat (−4% ): Higher gilt yields cut NAV ~5%; inflation-linked income partly offsets; discount widens to ~20%. UKW’s NAV is the present value of 20+ years of future cash from its wind farms. To calculate it, the trust discounts the FCF at a rate that follows gilt yields. When gilt yields rise, future cash is worth less today, so NAV falls. When rates fall, NAV rises. When gilts pay 5.5%, the extra yield for taking wind and power-price risk looks thin, so investors pay less for the shares and the discount widens.
Bust (+17%): Falling gilt yields lift NAV, cheaper gas lowers power prices; discount narrows. Investors compare UKW’s 8.8% yield with what gilts pay. When gilts pay 4%, UKW’s yield looks generous and the discount narrows.
Portfolio fit. Core Bucket 2 income with an inflation link, and one of the few holdings that does well in Bust. The risk is the end of subsidies, about seven years away on average, after which more of the income depends on wholesale power prices.
Signposts. Full-year results and the 2027 dividend target (February). Gearing back under 40%. The 10-year gilt, now about 4.9%.
Dunelm (DNLM): 8.1% including the special dividends. Buy.
What it is. The UK’s largest homewares and furniture retailer, with 7.9% of the market, selling through stores and online. It has low debt and returns surplus cash as a special dividend.
Dividend. TTM 70.5p, 8.1% at 868p: 17p interim and 25p special (both April 2026), plus the 28.5p final (November 2026). Specials have been paid five years running, at 37p, 40p, 35p, 35p and 25p. The ordinary dividend of 45.5p is covered 1.69x, below the 1.75–2.25x policy. The special roughly tracks earnings left after the ordinary dividend, about 32p a share. This year’s 25p was set below that after a weak H2 FY25, when free cash flow was −£6.8m.
Balance sheet. Net debt £94.6m excluding leases. FY26 free cash flow of £234.9m is the highest in five years.
Latest results (FY26, to June). Sales +3.1% to £1,825.5m, like-for-like +0.8%, gross margin 52.5%. Profit before tax was flat at £211.0m, but H2 rose 10.5% to £97.0m. CEO Clo Moriarty: “We delivered a solid performance for the year, growing sales, maintaining profits.” FY27 began with “significantly softer trading in first six weeks” because of hot weather, then improved.
Why the price moved. Down 26% from its 1,172p high. Four years of flat profits, a smaller special and the weak start to FY27.
Weighted return: +10%
Base (+28%): Wages outpace prices again, households spend more on their homes, and investors pay more for retailers; Earnings rise slightly and the special holds at 25–30p.
Overheat (-4%): high energy bills and mortgage rates leave households less to spend. Earnings stall, the shares are valued lower and the special shrinks to ~15p.
Bust (-12%): people put off buying furniture and homewares. Earnings fall about 15% and the special is cut.
Portfolio fit. Plan on about 70–75p a year (8–8.5%), not the 45.5p ordinary alone. It is our main exposure to a UK consumer recovery.
Signposts. H1 FY27 results in February, when the special is set. Bank of England decision on 5 November.
Annaly Capital Management (NLY): 15.7% yield. Small position.
What it is. A US mortgage REIT. It borrows short-term, mainly through repo, to buy home-loan bonds guaranteed by US government agencies, and earns the gap between bond yields and funding costs. Capital is 55% agency bonds, 23% residential credit and 22% mortgage servicing rights.
Dividend. TTM $2.90, 15.7% at $18.49. The forward rate is $3.00 ($0.75 a quarter), 16.2%. The TTM dividend was $3.52 in 2021–22, fell 26% to $2.60 in 2023 when funding costs rose faster than bond yields, and has recovered to $2.90. Earnings available for distribution (EAD) were $0.80 in Q3, covering the $0.75 dividend 107%. GAAP EPS was −$1.36, because it includes mark-to-market losses.
Balance sheet. Assets $146.2bn against equity $15.9bn: GAAP leverage 8.0x, economic leverage 5.9x, hedge ratio 100%. Available liquidity is $8.5bn, about 6.5% of liabilities. Equity has grown 49% in three years through share issuance, while book value per share stayed roughly flat.
Latest results (Q3 2026). Book value fell 11.4% to $17.86, an economic return of −7.6%. Net interest margin fell 7bp to 1.69%. CEO David Finkelstein: Annaly “out-earned its dividend in Q3 and expects to do so in Q4”. He put book value up about 2–3% since quarter-end.
Why the price moved. Down about 25% from the August high near $24.50. Half came from book value (−11%), half from the premium to book shrinking from 1.22x to 1.04x. In September the 10-year Treasury rose more than 50bp to its highest since 2007, the Fed hiked, and current-coupon mortgage bond spreads widened 13bp to 125bp.
Weighted return: +15%
Base (+27%): interest rates settle, so mortgage bonds recover some of September’s losses. Book value rises, the shares trade a little above book again, and the $0.75 dividend is paid in full.
Overheat (-4%): rates keep jumping, so mortgage bonds fall again and book value drops about 12%. Borrowing costs rise faster than income, so the dividend is cut to about $0.65 late in 2027. The dividends roughly cancel out the price fall.
Bust (+11%): the Fed cuts rates, so Annaly’s borrowing gets cheaper and its earnings improve. But its other holdings lose value, servicing rights because more homeowners refinance and credit holdings because more borrowers default. The shares dip sharply mid-year before recovering, and the dividend holds.
Portfolio fit. High income with flat-to-falling capital over time. It is hurt in the same scenario as our gilts, so it adds income, not protection. About 3% of the portfolio adds roughly 0.5 points of yield.
Signposts. October CPI (10 November), the 9 December Fed projections, the mortgage bond spread (above ~135bp is a warning), and Annaly’s mid-quarter book value comments.
Ellington Financial (EFC): 13.3% monthly, small position.
What it is. A US mortgage REIT that mainly owns credit-sensitive loans rather than government-guaranteed bonds. The $5.93bn long portfolio is 45.3% non-QM residential loans (borrowers outside agency rules like self-employed people with irregular income), 16.8% residential transition loans and 14.1% commercial mortgage loans, with agency bonds now under $200m. It also owns Longbridge, the #2 issuer of reverse-mortgage bonds (29% market share). It pays monthly.
Dividend. TTM $1.56 (twelve payments of $0.13), 13.3% at $11.71, unchanged from a year earlier. The rate was cut from $0.15 to $0.13 in March 2024. Adjusted distributable earnings (ADE) were $0.60 in Q2 against $0.39 paid, and $1.15 against $0.78 in H1, about 1.5x cover. Management guided the run rate down to the “high 40s” a quarter, which would still cover the $0.39 about 1.2x. TTM free cash flow of $950m ($7.37 a share, 4.73x cover) is inflated by loans sold into securitizations, so it is not a useful measure here.
Balance sheet. Book value $13.61 at 30 June, up from $13.56, so the price is 0.86x book. Recourse debt is 1.9x equity; including non-recourse securitization debt it is 9.2x. Cash is $247.5m and unencumbered assets $1.86bn. About $2bn was securitized in Q2, moving short-term repo funding into longer-term non-recourse debt. Shares rose to 128.9m through at-the-market issuance (2.8m shares in Q2).
Latest results (Q2 2026). GAAP EPS $0.43, with Longbridge contributing $0.24. Longbridge originations rose 38% to $589.7m. Cumulative realised credit losses are 17bp on $20.4bn of residential loans and 39bp on $2.5bn of commercial bridge loans. CEO Laurence Penn: “Ellington Financial delivered another standout quarter.” Higher rates caused unrealised losses on swaps that hedge its unsecured notes and preferred shares.
Why the price moved. Down about 13% from roughly $13.50 in August to $11.71. September’s rate jump and wider mortgage spreads hit the sector, and part of Q2’s earnings came from securitization gains that management does not expect to repeat.
Weighted return +9%
Base (+18-22%): earnings stay well above the dividend, so the $0.13 monthly payout is safe. Book value rises a little. The discount to book shrinks from about 16% to 5% as investors regain confidence in lenders. A higher share price plus a year of dividends gives +29%.
Overheat (+1%): investors demand more yield on riskier loans, so the loans EFC holds lose value and book falls about 8%. Its reverse-mortgage business, Longbridge, does better when rates are higher, which helps keep the dividend whole. The price falls about 12%, and a year of dividends roughly offsets it.
Bust (-9%): in a recession more borrowers default, especially on non-QM home loans and commercial property loans. Book falls about 10%, and EFC trims the monthly payout to about $0.10 in 2027. The price falls about 20%, and the smaller dividends don’t make it up.
Portfolio fit. The best-covered of the US credit names, with lower recourse leverage than NLY and a monthly payout. Unlike NLY it carries credit risk on its loans, so it suffers more in Bust and less in Overheat. Keep it around 2–3%.
Signposts. Q3 results after the close on 4 November (call on 5 November): ADE against the $0.39 quarterly dividend, and book value against $13.61.
Blackstone Mortgage Trust (BXMT): 10.9% yield after the cut. Small and staged position.
What it is. A US commercial property lender managed by Blackstone. It makes 3–5 year floating-rate loans to owners of offices, flats, hotels and warehouses in the US, Europe and Australia. The $17bn book is 27% multifamily, 24% industrial, 23% office and 12% hospitality.
Dividend. TTM $1.20 at the new $0.30 quarterly rate, 10.9% at $11.04, down 36% from $1.88 ($0.47 a quarter). Screeners will keep showing about 17% until the old payments drop out of the trailing figure. Distributable EPS before realised losses was $0.42, but that includes a one-off $0.04 tax benefit and about $0.05 of interest from loans now impaired. That leaves about $0.33 a quarter, cover of roughly 1.0–1.1x. Asked by UBS what earnings support the $0.30, management gave no number.
Balance sheet. Book value $17.06, down 12%. The drop came from loss reserves (−$1.59), loans marked for sale (−$0.38), repossessed property (−$0.22) and depreciation (−$0.13), partly offset by buybacks (+$0.08). Reserves total $3.64 a share. Leverage is 3.9x, liquidity $1.3bn, and 89% of debt cannot be called when prices fall. After the Q1 2027 notes are repaid, the next maturity is 2029.
Since dividend cut (Oct 29, 2026), analysts have reset their targets to $12–14 down from $13-21: Buy at UBS and JPMorgan ($14) and Hold at KBW ($12). Even the bulls value the shares at 0.70–0.82x book, so none expects the discount to close soon.
Latest results (Q3 2026). GAAP loss of $1.95 a share after about $800m of impairments, mostly legacy office. Problem loans and repossessed property are 14% of the book, carried about 30% below the original loan. About $1bn of loans were sold at 93 cents per dollar of carrying value, and the watch list fell 56%. CEO Tim Johnson: “we now have only one $57 million watchlist loan in the office sector that has not been previously impaired.” On the shares: “an additional $1 billion discount to our book value.” JPMorgan’s analyst noted that “the identification stage of problems within the portfolio has persisted”.
Why the price moved. Down 35% since June, to about 0.65x book. The weekly chart has broken to new lows with no clear support. The 2009 low of $4.42 belongs to Capital Trust, the near-bankrupt predecessor Blackstone recapitalised.
Weighted return: +7%
Base (+27%): borrowers keep repaying the older loans and no new problems appear, so book value holds and the $0.30 dividend is safe. Investors stop expecting more losses, and the discount to book narrows from 35% to about 25%. A higher share price plus a year of dividends gives +27%.
Overheat (−13%): if the 10-year Treasury yield goes above 5.5%, property values fall again. That hurts most the $5.7bn of loans made before 2023, when property prices were higher. Borrowers struggle to refinance, BXMT writes down more loans, book falls, and the dividend may be cut again.
Bust (−13%): in a recession hotels lose guests and homebuilders sell fewer homes, so more of those borrowers fall behind. Buyers for property also disappear for a while, so BXMT can’t sell problem loans or repossessed buildings to get its cash back. Book falls and the discount widens.
Portfolio fit. A bet on the Base case. Keep it to 2–3% and buy in thirds: one after Q4 results if earnings are at least $0.30, one near $9, one near $7.50 if the dividend holds. Buying before 31 December gets the $0.30 paid on 15 January.
Signposts. Q4 results in late January. Resolution of the Chicago office loan. The $500m of legacy office loans now refinancing. A weekly close above $13.40.
Mach Natural Resources (MNR): 13.9% yield. Small position as an energy hedge
What it is. A US oil and gas producer structured as a partnership, run by Tom Ward (co-founder of Chesapeake). It operates in the Mid-Continent, Permian and San Juan basins. Production is 69% gas, 16% NGLs and 15% oil. The model is to buy producing assets cheaply, spend under 50% of operating cash flow on drilling, and pay out the rest each quarter.
Dividend. TTM $1.44 at the latest $0.36 quarterly payout, 13.9% at $10.35. The last four payments ($0.27, $0.53, $0.64, $0.36) add up to $1.80, the 17.4% screeners show. On a TTM basis the payout fell 44% from $3.20 (November 2024) to $1.94 (November 2025), and has held at $1.80–1.97 since. Much of the per-unit fall is dilution: units rose from 118m to 167m (+41%) to pay for acquisitions, while total cash paid stayed near $300m a year. The payout is variable by design: Q2 cash available for distribution was $60m, down from $107m, as realised gas fell to $1.93/Mcf from $2.74 and capex rose to $97m from $75m. Getting back to $1.80 needs about $75m a quarter.
Balance sheet. $730m drawn on a $1bn credit line. Leverage is 1.3–1.4x against a target of 1.0x by end-2027, to be reached through “equity placements, acquisitions, or a distribution cut”. Proved reserves doubled to 705 MMboe, with a PV-10 of $3.1bn, about the company’s enterprise value. Costs are low: $7.21/boe operating and $0.54/boe G&A.
Latest results (Q2 2026). Production fell to 149 MBoe/d from 158. Mancos gas completions and Red Fork drilling are deferred to 2027, and acquisitions are on hold. About 65% of San Juan gas is sold at $1.72 under a contract to 2030. Tom Ward: “The very reason to bring down debt during a period of exuberance is to be prepared to purchase in a time of want”, and “I am a holder just like the rest of the unitholders.”
Why the price moved. Near its 52-week low of $10.15 (high $15.02). Weak gas realisations and the lower payout.
Weighted return: +16%
Base (+18%): oil drifts back toward $80 and gas prices rise a little. MNR’s cash after drilling and interest stays close to today’s level, so the payout stays near $0.35 a quarter. The price barely moves, and the return is mostly the payout.
Overheat (+40%): oil stays near $100 and gas firms. MNR’s costs stay roughly fixed, so most of the extra revenue becomes cash for unitholders, and the payout rises to about $0.50 a quarter. A bigger payout lifts the price too, which is why this is the one stock that gains most in Overheat.
Bust (-23%): oil falls to $50–60 and gas weakens, so cash flow drops and the payout falls to about $0.20 a quarter. MNR has $730m of debt and wants to reduce it, so it may cut the payout further to pay down debt. The price falls by about a third, and the smaller payouts don’t make up for it.
Our scenarios set oil prices but not gas. Gas assumptions here are ours.
Portfolio fit. The holding that gains most in Overheat, so it offsets the credit names. Budget for $1.45–1.65 a year (14–16%), not the $1.80 TTM screeners show, and keep it small: the payout swings with gas prices every quarter.
Signposts. Q3 results in early November. Henry Hub gas and San Juan basis. Progress toward 1.0x leverage, and any use of the $100m equity programme.
Blue Owl Technology Finance (OTF): wait for results on 4 November, 16.4% yield
What it is. A business development company (BDC) that lends to private, mostly private-equity-owned software and tech companies. It must pay out at least 90% of taxable income and may borrow at most $2 per $1 of equity. The $14.7bn portfolio spans 205 companies and is 77.8% first-lien. Loans are mostly floating-rate.
Dividend. TTM $1.60, 16.4% at $9.75: four $0.35 base payments plus four $0.05 specials. The run of five $0.05 specials ended in October, and none has been declared since. Adjusted net investment income (NII) was $0.30 in Q2 and $0.29 in Q1, about $1.20–1.30 a year. That covers 86–93% of the $1.40 base and 75–81% of the TTM total. GAAP earnings of $0.81 (a 173% payout) include a −$220m Q1 loss from marking loans down. Free cash flow is not a useful measure for a BDC, because loan purchases and repayments run through operating cash flow.
Balance sheet. NAV $16.48, down 4% from $17.17 a year earlier. Net debt rose from $4.58bn to $6.94bn in a year, taking leverage from 0.58x to 0.93x. Liquidity is over $2bn. The 95% revenue growth is mostly the merger with OTF II, which doubled the share count to about 461m.
Latest results (Q2 2026). Non-accruals 0.6% at cost and 0.1% at fair value. Buybacks of $55m. Revenue fell to $322m from $427m in Q1. CEO Craig Packer: “OTF’s second quarter stability reflected the strong credit quality of our portfolio.”
Why the price moved. The shares trade about 41% below NAV, near their 52-week low. The market fears AI will erode software companies’ revenue and their ability to repay. Defaults do not show it yet, but the Q1 markdowns are a first sign.
Weighted return: +13%
Base (25%): the software companies OTF lends to keep paying their interest, so few loans go bad. OTF lowers the dividend to about $0.30 a quarter, a level its earnings cover. With no new losses, the AI fear eases, and the discount to NAV narrows from 41% to about 30%. A higher price plus a year of dividends gives +25%.
Overheat (8%): OTF’s loans are floating-rate, so higher rates mean borrowers pay it more interest. That extra income could keep the $0.35 dividend. But the most indebted borrowers struggle with the higher payments, so some loans lose value and NAV falls about 5%. The price slips, and the larger dividends keep the return positive.
Bust (-12%): the Fed cuts rates, so OTF earns less interest on the same loans. In a recession tech companies sell less, more borrowers default, and NAV falls about 15%. The dividend drops to about $0.27 a quarter, the discount widens, and the price falls by about a quarter.
Portfolio fit. The only credit name that holds up in Overheat. The risk outside our scenarios is a multi-year erosion of software business models by AI.
Signposts. Q3 results after the close on 4 November (call on 5 November): NAV at or above $16.30, non-accruals under 1%, a dividend set at a level NII covers, and an explanation of the Q2 revenue drop.
Oxford Lane Capital (OXLC): avoid, 36% yield at risk
What it is. A closed-end fund that buys the equity tranches of collateralised loan obligations (CLOs): pools of about 200 leveraged loans funded mostly by rated debt. The equity tranche keeps whatever is left after the debt is paid, so it is about 10x levered before the fund adds its own notes and preferred shares.
Dividend. TTM $2.40 at the current $0.20 a month, 36.4% at $6.60, against $4.80 a year earlier at $0.40 a month. In January the board halved the monthly payout to $0.20, saying “it would be beneficial for the Company and its shareholders to have additional capital to deploy”. That is about 23% on NAV. In the June quarter, GAAP NII of $0.51 covered 85% of the $0.60 paid. Core NII of $0.95 includes cash that is partly a return of capital, and it has fallen from $1.12 to $1.03 to $0.95.
Balance sheet. NAV was $19.19 in September 2025, $15.51 in December, $10.56 in March and $10.74 in June, with an August estimate of $10.34–10.64. NAV total return over the year was about −28%, including dividends. On leverage, CEO Jonathan Cohen said “we certainly would be not looking to increase that through the issuance of any additional debt.”
Latest results (June quarter). CLO equity effective yield fell to 11.1% from 14.6% a year earlier, and the cash distribution yield to 16.3% from 19.4%, as loan spreads compressed. Loan defaults rose to 1.4%. The bid-ask spread on CLO equity trades is “improved... compared to the end of March”, per Joseph Kupka. Management’s hope is that a recovery will “be driven by an active refi and reset market for CLO liability stacks.”
Why the price moved. From $15.87 to about $6.60 in a year, now 37–40% below NAV. The fund used to trade at a premium and issue shares into it. It fell another 13% in October with no company-specific trigger we could find.
Weighted return: +3%
Base (20%): even when nothing goes wrong, OXLC pays out more than it earns, so NAV keeps shrinking, by about 15% over the year. It trims the monthly payout to about $0.15 in 2027. The price falls, but the payouts are large enough to leave +20%. Part of that “income” is your own capital being handed back.
Overheat (-3%): OXLC owns the bottom slice of pools of corporate loans (CLOs), which is paid last. When higher rates push weaker companies into default, that slice loses value first, so NAV falls about 30%. The large payouts roughly offset the price fall, but the capital is gone.
Bust (-30%): in a recession, if 4–6% of the loans default, CLO rules divert the cash that normally goes to the bottom slice to repay the safer debt above it. OXLC’s income largely stops, NAV halves, and the payout drops to about $0.10 a month. The share price halves too, and the payouts recover only part of the loss.
Portfolio fit. The widest range of outcomes in the group, from +20% to −30%, for a weighted +3%. Even with no recession, NAV has nearly halved in a year. The high payout is partly your own capital coming back.
Signposts. Second fiscal quarter results on 5 November: the 30 September NAV, and distributions for January–March 2027.
Wrap-up: what we would own
On our scenario weights, the eight range from +3% to +16% total return to end-2027. What matters for the portfolio is less the average than which scenario each one loses in.
Scenario returns are our estimates; the methods are in each company section.
What it means for the UK SIPP or ISA portfolio
The UK names are the core. UKW and DNLM pay 8–9% with cover above 1x and suffer less in a downturn than the US credit names. UKW does best of all eight in Bust.
US credit is a satellite. NLY, EFC and BXMT add 11–16% yields, but NLY and BXMT lose in Overheat, alongside our fixed-rate gilts and the Lloyds 2040 bond. Together they should stay around 7–8% of the portfolio.
MNR is the Overheat offset. It is the one holding that gains when energy stays high. That pairs with the index-linked gilt (T29) we added in the scenarios article.
Waiting costs little. OTF reports on 4 November. A reset dividend that NII covers would make it a reasonable small holding at about 12%.
An illustrative sleeve of UKW 4%, DNLM 3%, NLY 3%, EFC 2%, BXMT 2% and MNR 2%. That’s 16% of the portfolio, yielding about 11.4%, and adds about 1.8 points of income.
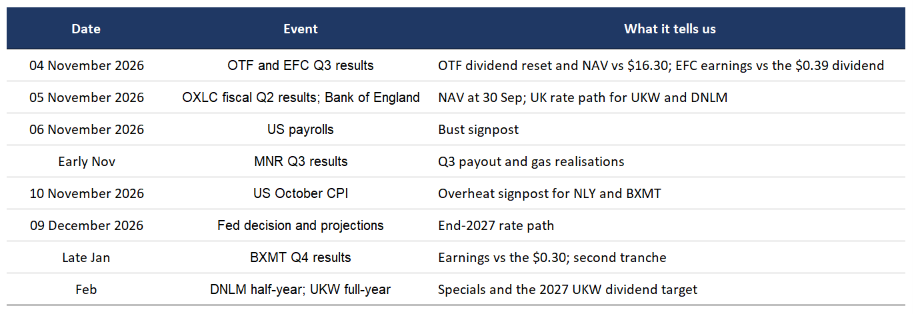
Signposts
Measures of cover by business type
Sources
UKW: half-year results, 30 Jul 2026; AJ Bell on CPI indexation; ii Stockwatch; AJ Bell price
NLY: Q3 2026 results; Q3 call highlights; dividend history; AGNC Monthly Macro Monitor, Sep 2026; Morgan Stanley Agency MBS Monitor Q3 2026
BXMT: Q3 2026 earnings call transcript, press release and 10-Q (29 Oct 2026); Q3 call highlights
OXLC: fiscal Q1 2027 results; Q1 call highlights; fiscal Q4 2026 call; distribution cut; August NAV estimate
MNR: Q2 2026 call; Q1 2026 call; reserves update; distribution history
EFC: Q2 2026 results; Q2 call highlights; dividend history; price history; Q3 results date
Balance sheet, cash flow and dividends from TradingView.
Income
Explore all company fundamental valuations, DCF intrinsic models, and thematic deep-dives in Income.
Quantitative Models
Automated daily equity screening across 6 quantitative factor models with 15-minute EMA regime confirmation.
More Research from the Desk
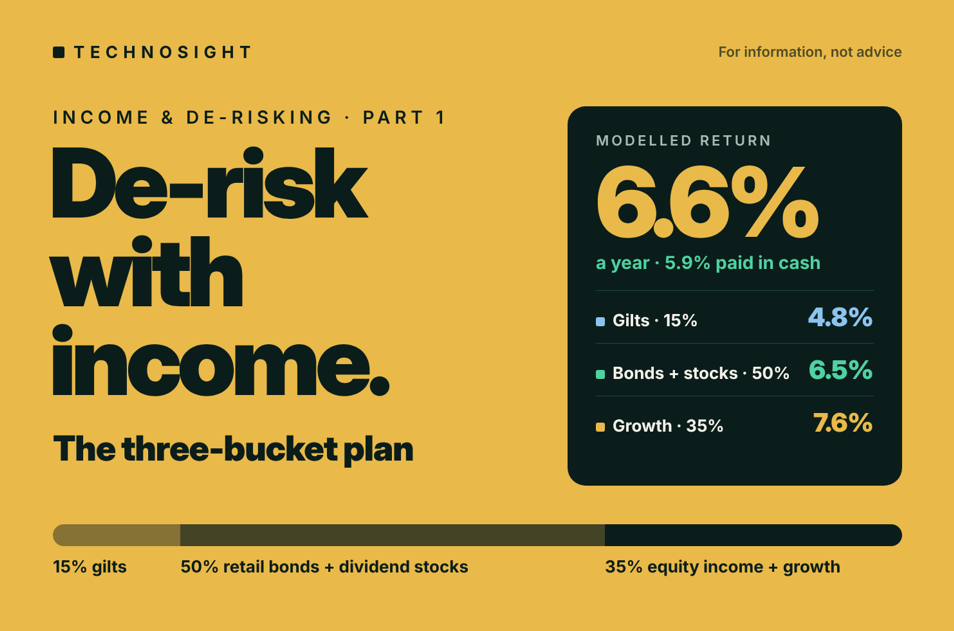
De-risking a portfolio with gilts, dividend stocks and bonds for a modelled 6.6% a year
After five months of near-zero returns in US equities, this plan moves half a portfolio into assets that pay on schedule. Bucket 1 holds two short gilts to fund two years of spending. Bucket 2 holds four UK investment-grade retail bonds and eight dividend stocks with strong free cash flow and whose dividend rose YoY. Bucket 3 holds two Premium Income and High Dividend ETFs. Modelled return: 6.6% a year, of which 5.9% is in cash. The trade-off: to be rebalanced if the AI rally resumes.
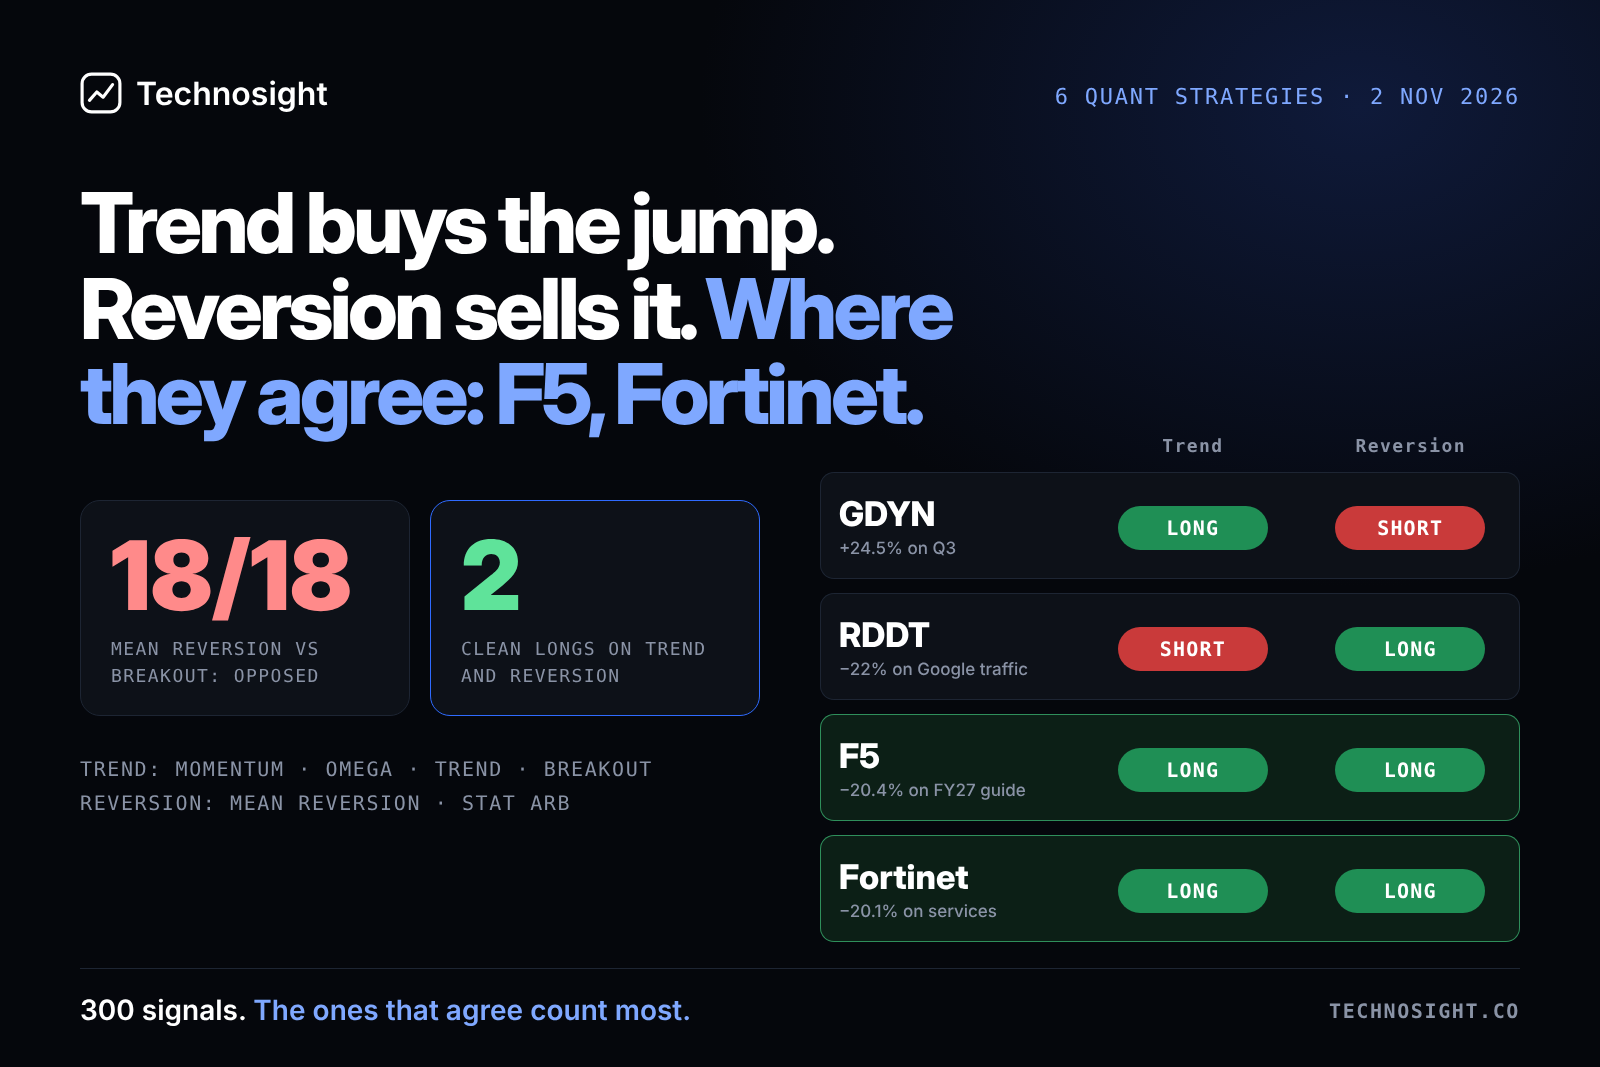
Signals and themes from quant strategies after last week’s earnings: FTNT, F5 and healthcare
We reviewed 300 signals from our six quant strategies together. Strategies split into two families (trend and reversion) that read last week’s earnings in opposite ways. The trend family (Momentum, Momentum Omega, Trend Following, Volatility Breakout) is buying the stocks that jumped, such as Grid Dynamics (+24.5% on 30 Oct) and Regeneron (+11.5%). The reversion family (Mean Reversion, Statistical Arbitrage) is shorting them and buying the stocks that fell, such as Reddit (−22%). The most valuable signals are the ones both families back: F5 and Fortinet, each long across both families with no votes against them, each down about 20% after beating on the quarter and guiding to slower growth. Beyond the stocks, two themes stand out: healthcare catalysts lead momentum, and the market is selling companies that guide lower or pay heavily for AI.