
De-risking a portfolio with gilts, dividend stocks and bonds for a modelled 6.6% a year
After five months of near-zero returns in US equities, this plan moves half a portfolio into assets that pay on schedule. Bucket 1 holds two short gilts to fund two years of spending. Bucket 2 holds four UK investment-grade retail bonds and eight dividend stocks with strong free cash flow and whose dividend rose YoY. Bucket 3 holds two Premium Income and High Dividend ETFs. Modelled return: 6.6% a year, of which 5.9% is in cash. The trade-off: to be rebalanced if the AI rally resumes.
De-risking a portfolio with gilts, dividend stocks and bonds for a modelled 6.6% a year
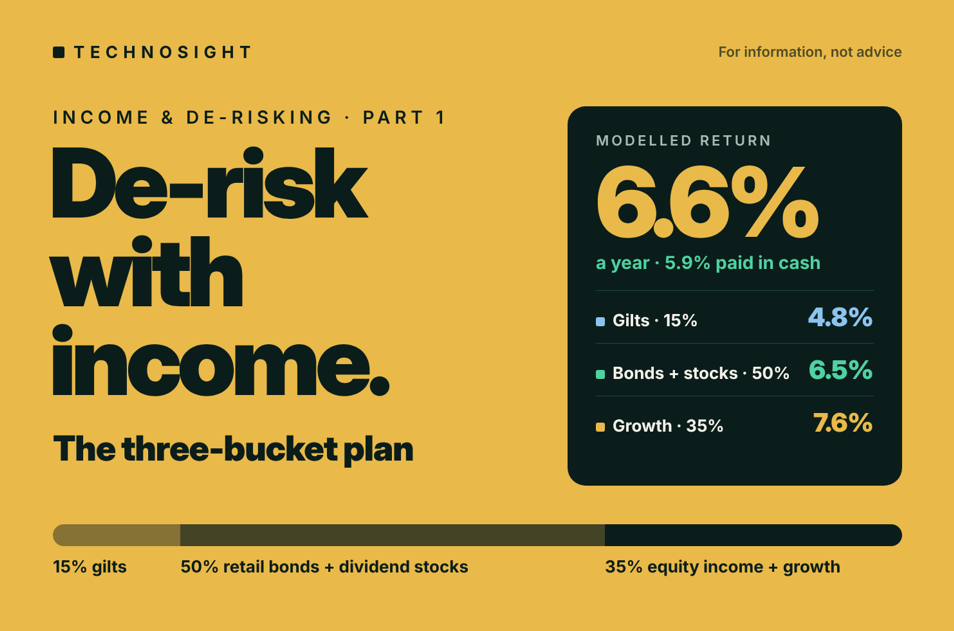
15% gilts | 50% retail bonds & dividend stocks | 35% equity income & growth | Modelled return 6.6%, 5.9% in cash
Takeaway: After five months of near-zero returns in US equities, this plan moves half a portfolio into assets that pay on schedule. Bucket 1 holds two short gilts to fund two years of spending. Bucket 2 holds four UK investment-grade retail bonds and eight dividend stocks with strong free cash flow and whose dividend rose YoY. Bucket 3 holds two Premium Income and High Dividend ETFs. Modelled return: 6.6% a year, of which 5.9% is in cash. The trade-off: to be rebalanced if the AI rally resumes.
Research series: This is the first note in a new series on gilts, retail bonds and dividend stocks. It is written for a UK tax-free wrapper such as a SIPP or ISA, which shapes several choices: coupons and dividends are not taxed, so high-coupon bonds and high-yield funds carry no tax penalty.
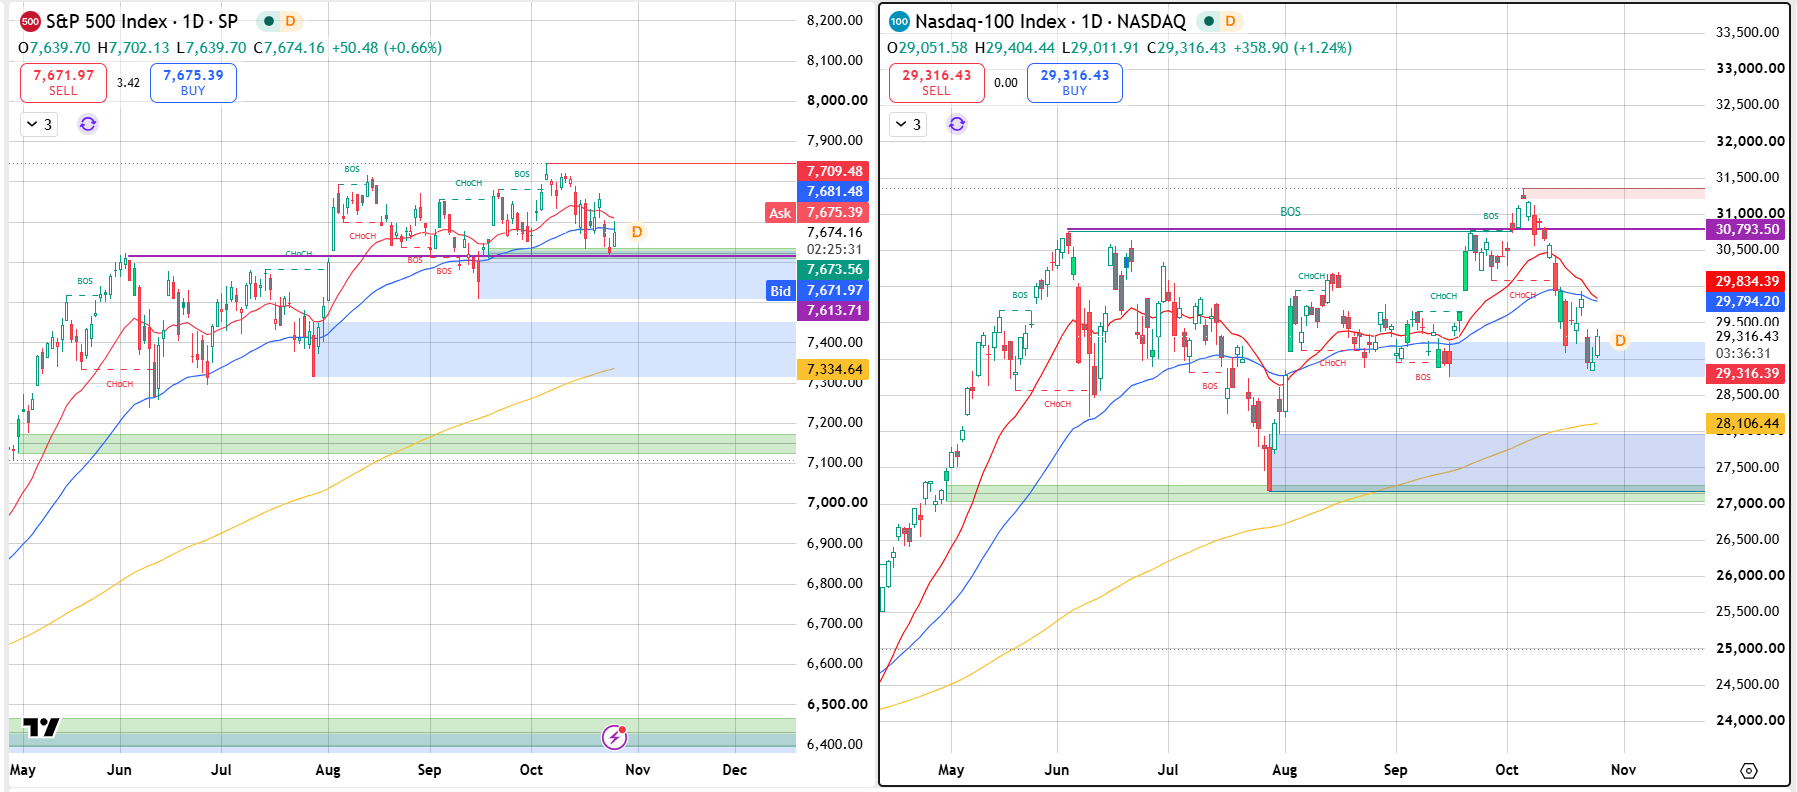
The case for de-risking now is the gap between where risk sits and what it pays. S&P 500 is roughly back to June 1, 2026 level. Nasdaq - to Mid-May level. About 5 months of near-zero return.
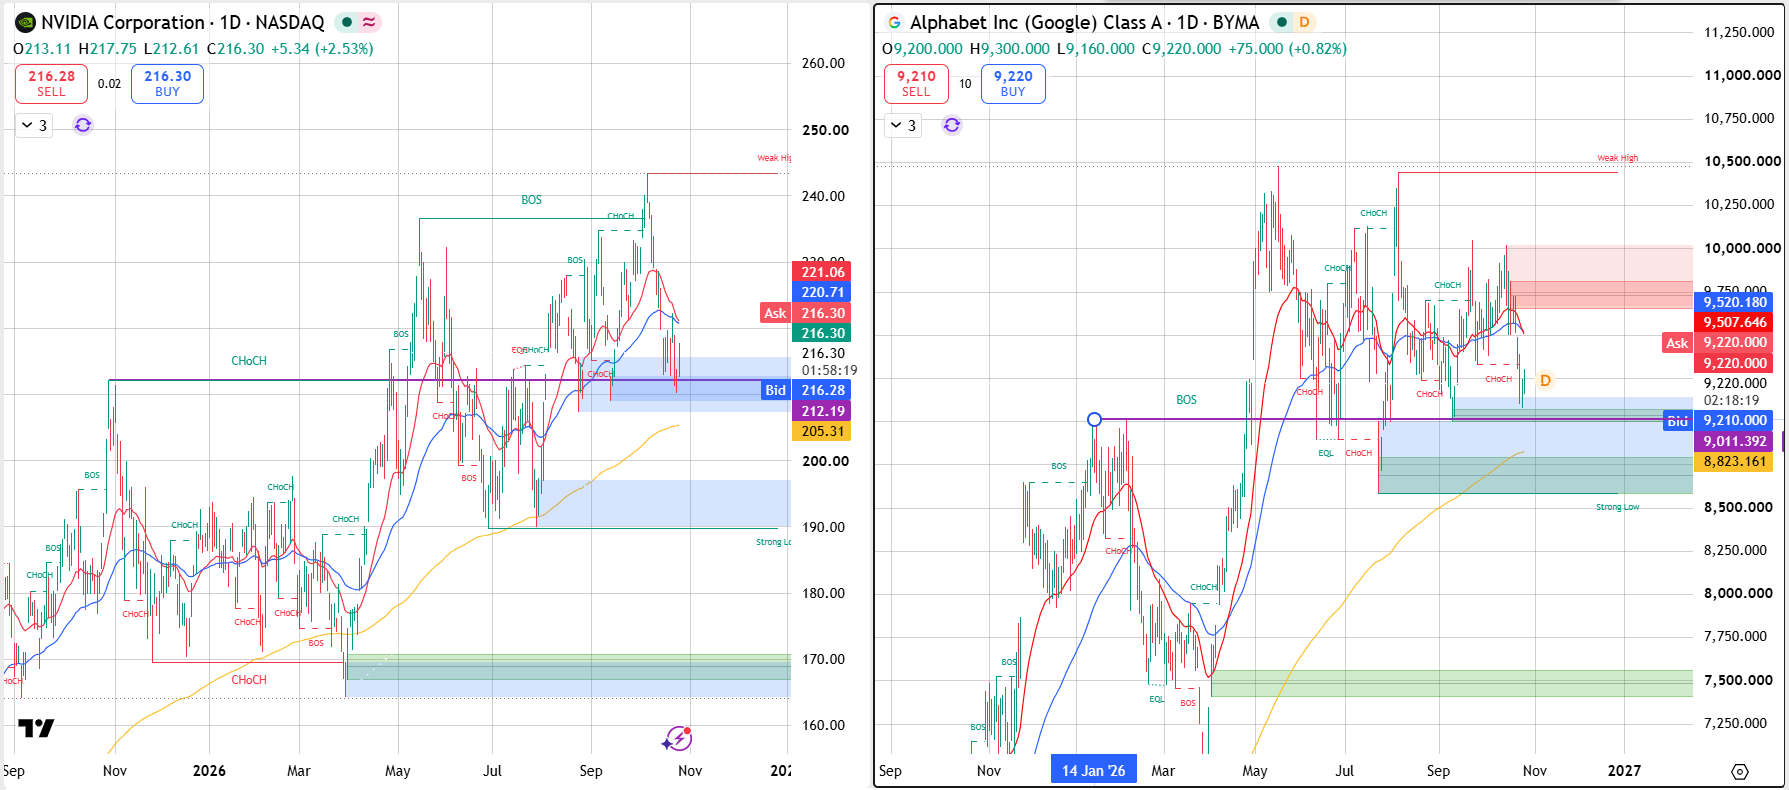
After the AI rally, a growth-heavy portfolio is concentrated in a handful of richly priced names (e.g. NVIDIA is back to November 2025 level, Alphabet to January 2026 level), while UK bond yields still pay >6% on investment-grade paper. Income that arrives in cash every quarter does not depend on selling shares at a bad moment.
The structure: three buckets
Each bucket has one job, a time horizon and a return target. Money flows downhill: Bucket 3 refills Bucket 2, Bucket 2’s income refills Bucket 1, and spending comes from Bucket 1.
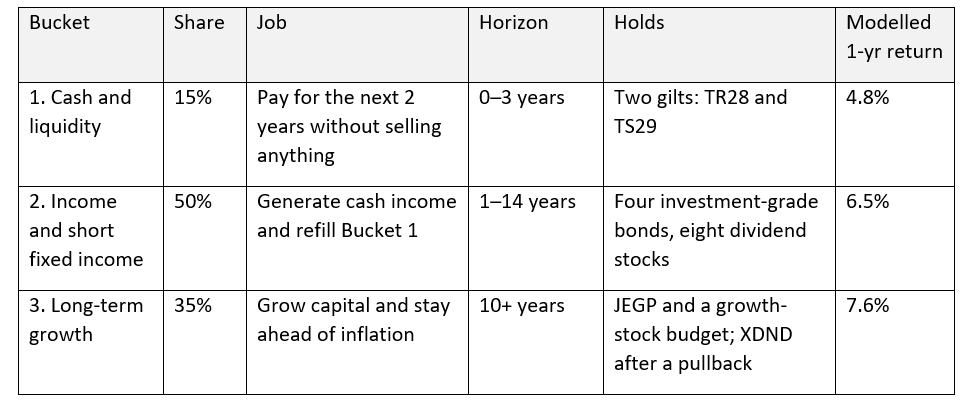
Weighted by size, the three buckets model to about 6.6% a year. Money held in cash while waiting to be deployed earns less, so the realised return in the first year will trail that figure until the buckets are full.
The 50% weight on Bucket 2 is the de-risking decision. It moves half the portfolio from paying out only when shares are sold to paying out on a calendar: coupons on fixed dates, dividends quarterly, ETF distributions monthly or weekly.
Bucket 1: Cash and Liquidity (15%)
Choosing short gilts
Twelve conventional gilts mature within three years, yielding 4.18% to 4.93% to maturity. Two numbers separate them: the yield to maturity, which is the total return a year if the gilt is held to the end, and the running yield, which is the cash it pays each year.
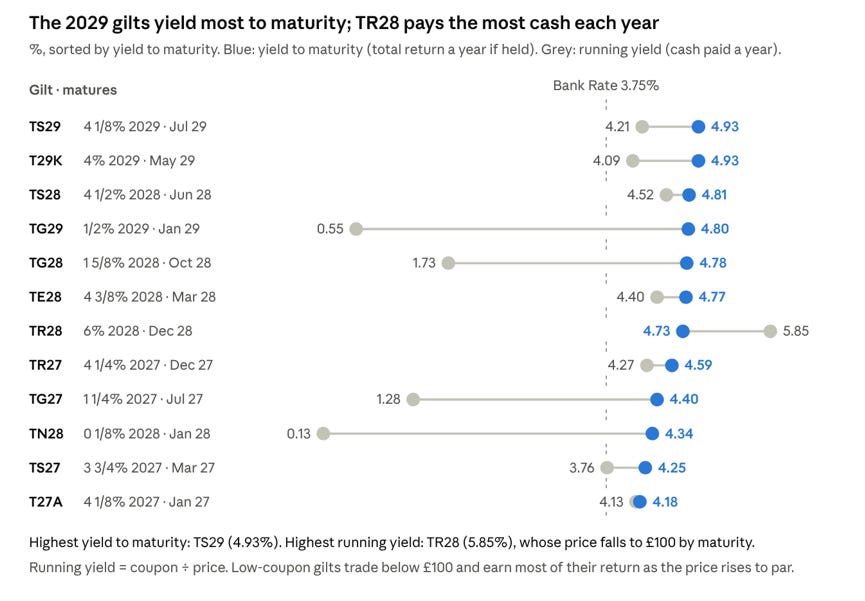
Low-coupon gilts trade below £100, so most of their return arrives at maturity as the price rises to par; the 0 1/8% 2028 pays just 0.13% a year in cash. TR28 is the reverse: it pays 5.85% a year, but its price falls from £102.53 to £100 by 2028, leaving a 4.73% total return.
The plan holds both ends of this trade-off. TR28 is the income choice, not the yield choice. TS29 is the yield choice: 4.93% to maturity, the highest on the list.
Pros of short gilts
Repaid by the UK government at £100 on a known date, with no compensation-scheme cap.
Yield locked to maturity, 0.4–1.2 points above Bank Rate at 3.75%.
Traded every day on the exchange, so a gilt can be sold early if plans change.
Cons
Sold before maturity, the price can be lower: a 2029 gilt loses about 2.5% for each 1-point rise in yields.
Returns are fixed in GBP. With the Bank of England expecting CPI near 3.75% in Q4 2026, the inflation-adjusted yield is about 0.4–1.2 points.
Low-coupon gilts pay little cash along the way; their return arrives at maturity.
When a gilt matures, the money may have to be reinvested at lower rates.
Dealing spreads and platform fees take a bigger share of the return on the shortest gilts.
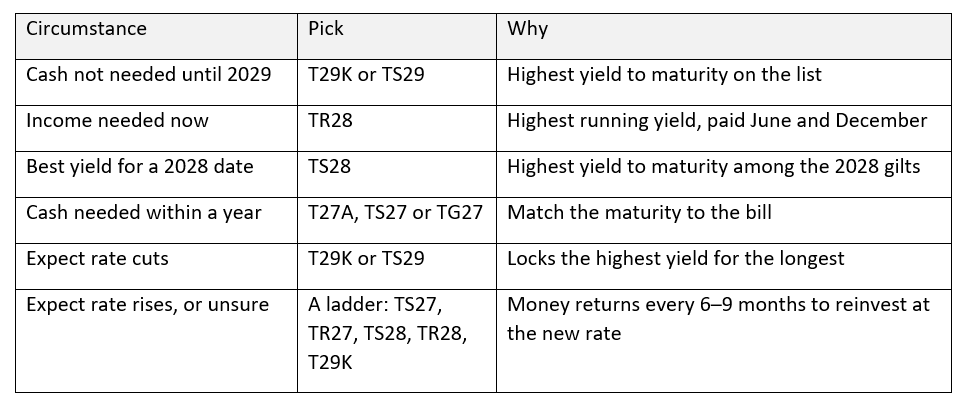
Which gilt for which circumstance
Index-linked or conventional?
Index-linked gilts raise both coupon and repayment in line with RPI (retail price index), so they quote a real yield on top of inflation instead of a fixed nominal one. RPI ran at 3.9% in the 12 months to September 2026, against 3.5% for CPI (ONS). All three short linkers mature before RPI is aligned with CPIH in 2030, so they pay full RPI to the end. Their coupons are tiny, though, so almost all the inflation uplift arrives at maturity, not as cash along the way.
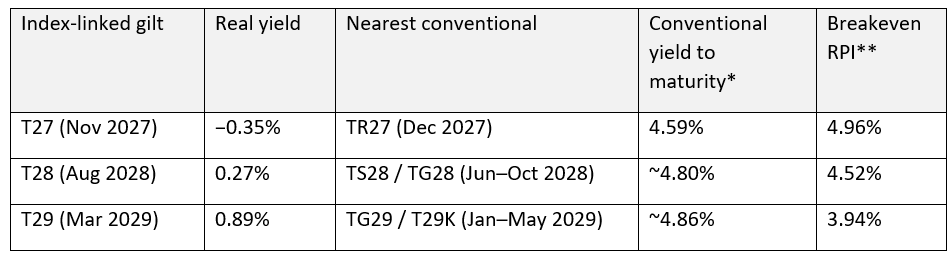
* Yield to maturity of the conventional gilt: the fixed yearly return before inflation if bought today and held to the end.
** Breakeven RPI: the average yearly RPI at which the index-linked and conventional gilts earn the same. Above it, the index-linked gilt wins.
The breakeven is the average RPI needed for the linker to match the conventional gilt. The 2027 and 2028 linkers need RPI of 4.5–5% a year, above today’s 3.9%, so conventionals are the better buy unless inflation surges. The 2029 linker breaks even at about 3.9%, today’s rate: it costs almost nothing extra to insure against inflation staying high, which suits spending that rises with prices. Conventionals still win on cash flow and certainty of the amount repaid.
What’s used in the modelled portfolio?
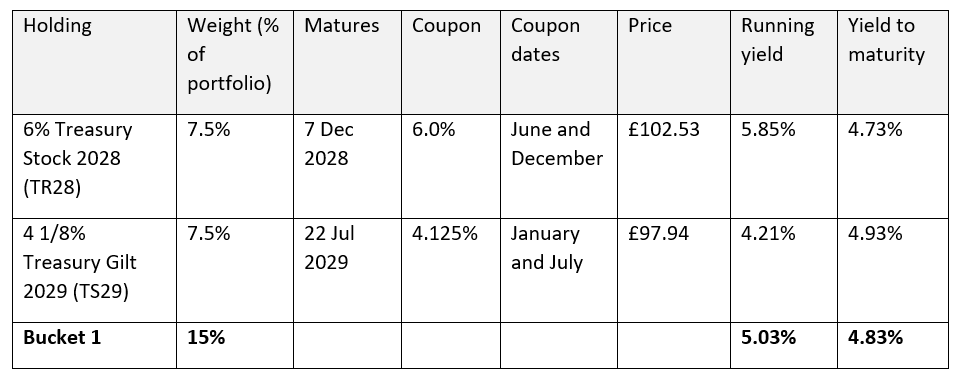
Bucket 1 holds two short-dated gilts in equal parts: the 6% Treasury Stock maturing 7 December 2028 (TR28) and the 4 1/8% Treasury Gilt maturing 22 July 2029 (TS29), plus cash for the next few withdrawals. Together they yield 4.83% to maturity and pay 5.03% a year in cash, with coupons in January, June, July and December. It is sized to cover about two years of spending, so a bear market does not force a sale of shares or long bonds.
Bucket 2: income and fixed income (50%)
Bucket 2 targets income from retail bonds and dividend stocks, modelled at 6.5% a year. Bond funds and dividend ETFs were considered, but not used because of their lower yields.
Bonds give the dated, contractual part of the income; dividend payers (selected below) add some dividend growth as inflation protection on top.
Choosing retail bonds
The focus here is on retail bonds because, unlike most institutional bonds, they trade in small lots, typically £100 to £1,000, rather than £50K - £100K.
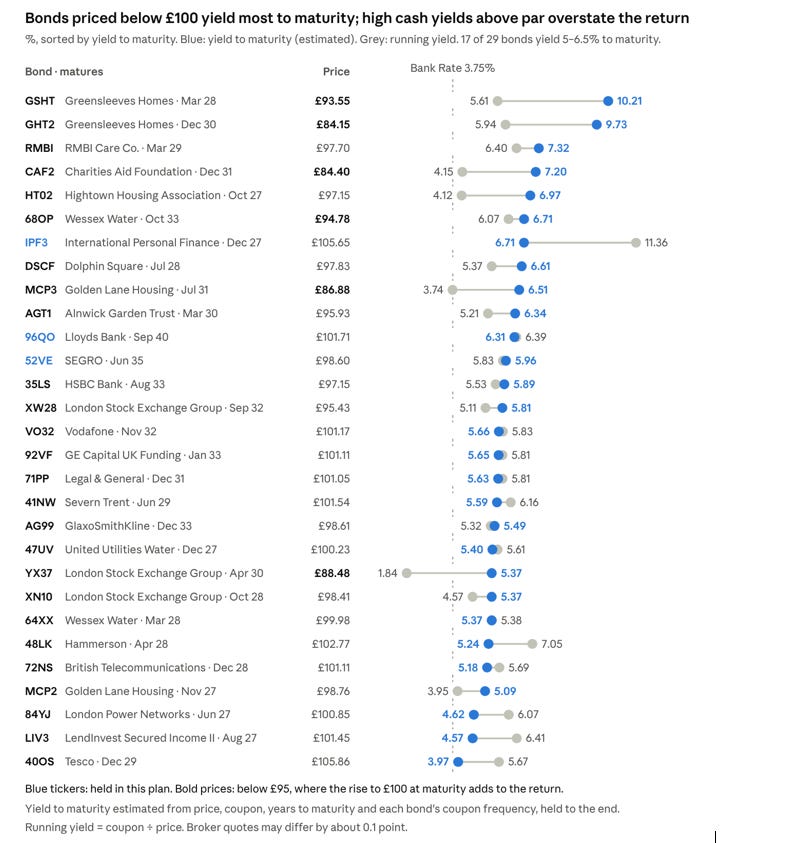
Running yield (coupon / price paid) and yield to maturity can point in opposite directions. For example, IPF pays 11.4% a year in cash, but yields about 6.7% to maturity because its price falls from £105.65 to £100 by December 2027.
Example:
The chart’s 6.97% for Hightown is the yearly interest rate at which the bond’s remaining payments are worth exactly what you’d pay for it today.
Coupon: 4% a year, paid twice a year (30 April and 31 October), so £2 per payment per £100 bond.
Price: £97.15. Matures on 31 October 2027, 1.01 years away.
What you pay
The last coupon was on 30 April, almost six months ago. The interest built up since then is nearly a full payment: 0.98 of a half-year × £2 = £1.96. You pay that to the seller on top of the £97.15 quoted price, so the full cost is £99.11.
What you get back
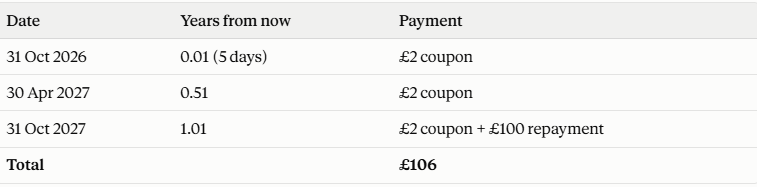
6.97% is the yearly rate at which the three payments, £2 in five days, £2 in April 2027 and £102 in October 2027, discounted back to today, add up to the £99.11 you pay. Put simply, £99.11 grows to £106 in about a year.
Shortlisting retail bonds
Filtering for investment-grade credit leaves four bonds as the highest yielders that remain: Hightown Housing 2027, Wessex Water 2033, Lloyds Bank 2040 and SEGRO 2035. Every bond that yields more than these is either unrated or rated below investment grade.
The filter: credit rating
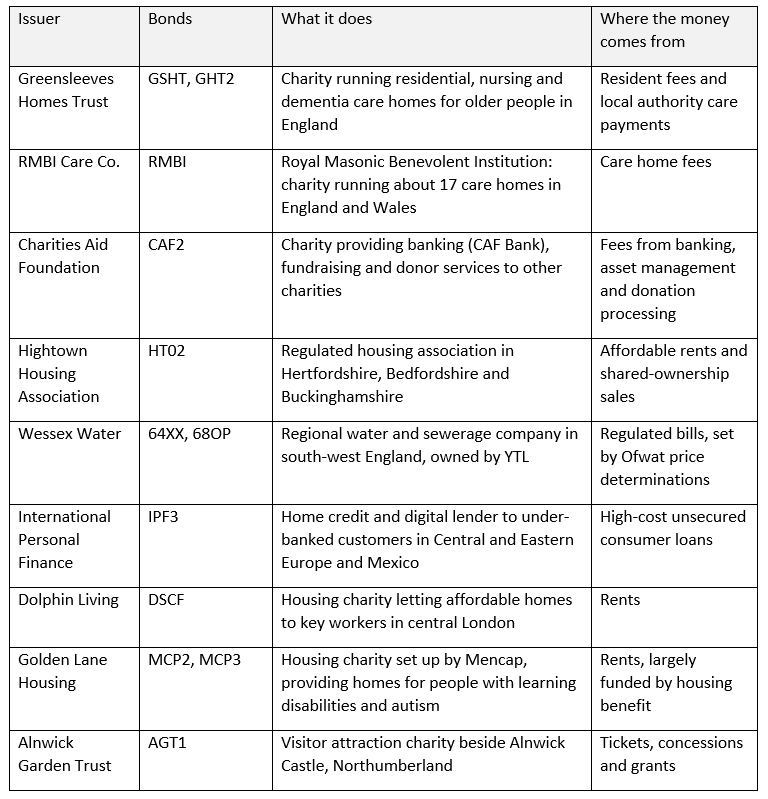
Drop unrated bonds. Most charity bonds have no rating because the charities do not pay the agencies’ fees. Their extra yield pays for that missing check and for thin trading. This removes Greensleeves, RMBI Care, Charities Aid Foundation, Dolphin Living, Golden Lane and Alnwick Garden.
Drop sub-investment grade. Fitch rates IPF BB with a stable outlook (May 2025), two notches below investment grade, citing “weak asset quality” offset by “adequate pricing and sound profitability” (Fitch via IPF).
Keep investment grade. Four bonds pass and lead the remaining yield table.
The shortlist
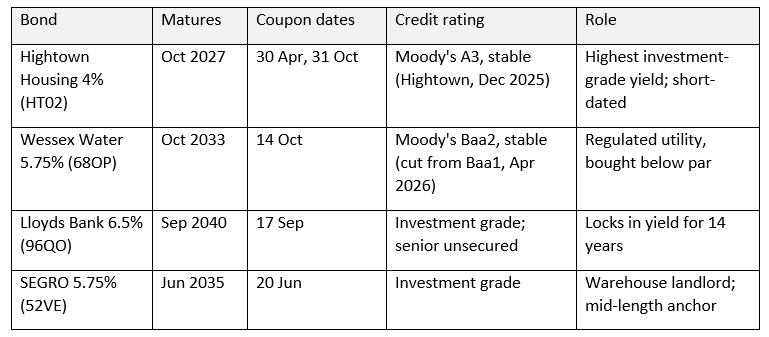
Hightown: Moody’s cites “strong operating margins and focus on core social housing lettings” (Hightown). The A3 rating belongs to the housing association; the bond is issued through RCB Bonds and lent on to Hightown. It repays in a year, so the money will need reinvesting in 2027.
Wessex Water: Moody’s cut the rating to Baa2 after the competition regulator’s price ruling, expecting gearing near 70% and no dividends during the 2025–30 period (The Water Report). It is the lowest-rated of the four.
Lloyds: the longest bond, so the most sensitive to rates, about −10% for a 1-point rise.
SEGRO: the lowest yield of the four, from the UK’s largest listed warehouse landlord.
Selecting dividend stocks: higher yield, tighter screening
Stocks have to pass two tests.
First, free cash flow must cover the dividend more than once, so the payout comes from cash the business generates rather than from borrowing or asset sales.
Second, the dividend per share must have risen over the past year: a board that raises its payout is signalling confidence, and a rising dividend is the plan’s protection against inflation. Eleven of 21 candidates pass both.
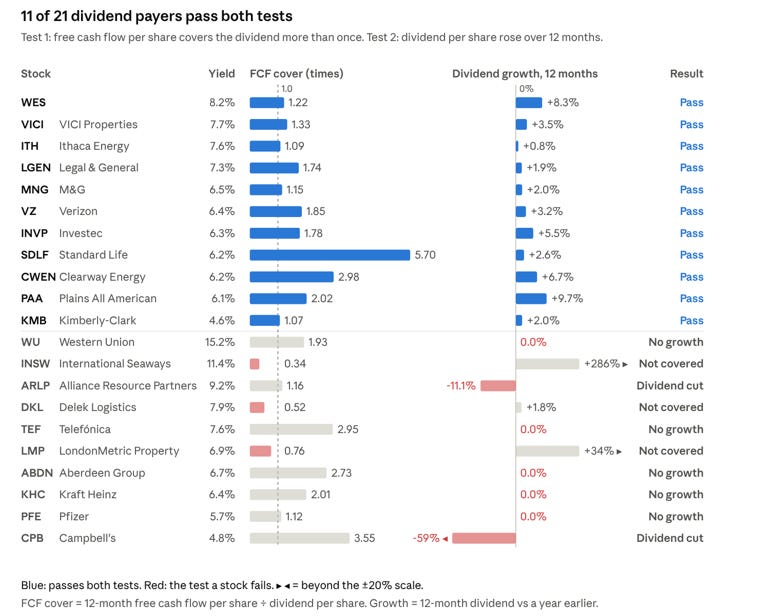
The failures fall into three groups. Five pay a covered dividend that has stopped growing: Western Union, Telefónica, Aberdeen, Kraft Heinz and Pfizer. Two cut: Alliance Resource Partners by 11%, and Campbell’s, whose quarterly payout fell 36% in September 2026. Three pay out more than they generate in free cash: International Seaways, whose 286% jump came from special dividends, Delek Logistics and LondonMetric.
The stocks that pass
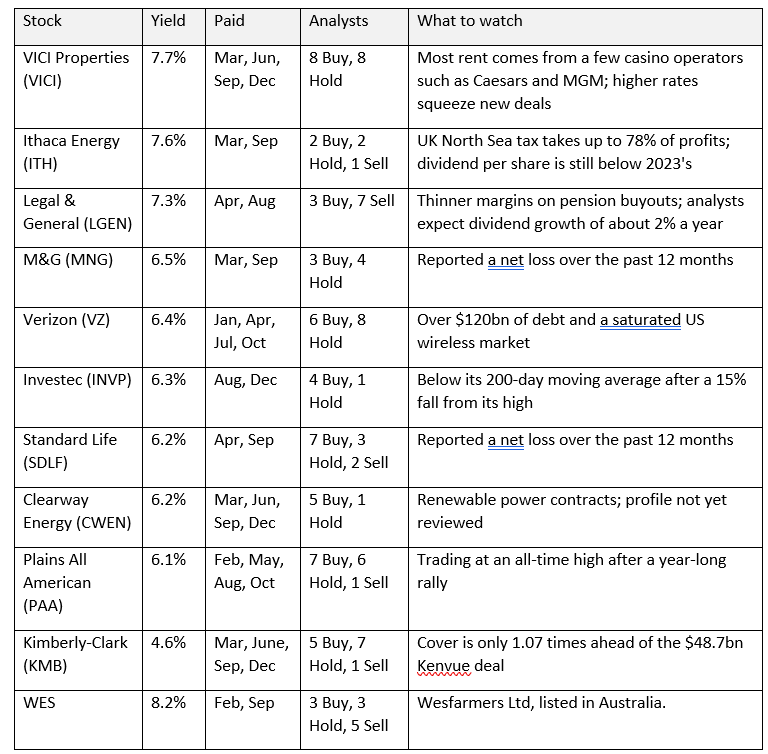
Three of the 11 stocks that pass the screen drop out. Ithaca Energy has the thinnest cover of the group (1.09) and a dividend still below its 2023 level. Kimberly-Clark covers its dividend only 1.07 times ahead of the Kenvue deal. WES is Wesfarmers, listed in Sydney, so every dividend and trade goes through an Australian-dollar conversion. That leaves eight: VICI Properties, Legal & General, M&G, Investec, Verizon, Standard Life, Plains All American and Clearway Energy.
Free cash flow is a weaker test for insurers and banks. Legal & General, M&G, Standard Life and Investec hold customer money, so their cash flow swings with policyholder and deposit flows; solvency ratios and cash remitted to the parent are the better checks.
Sizing Bucket 2
Bucket 2’s 50% is split evenly: 25% of the portfolio in the four shortlisted bonds and 25% in the eight stocks. On today’s prices the bucket pays about 6.1% a year in cash, and about 6.5% including the bonds’ rise to £100 at maturity.
The split follows four rules:
Half bonds, half stocks. Bonds pay fixed coupons and return capital on known dates, which is what refills Bucket 1. Stocks raise their payouts over time, which protects the income from inflation.
Bonds weighted by safety. SEGRO and Lloyds take 7.5% each as the longest investment-grade holdings. Hightown and Wessex Water take 5% each: Hightown repays in October 2027, and Wessex is the lowest-rated of the four at Baa2.
Stocks weighted by cover. Stocks whose free cash flow covers the dividend at least 1.7 times take 3.5%: Legal & General, Standard Life, Verizon and Clearway Energy. VICI and Plains All American take 3%: VICI because its rent depends on a few casino operators, Plains because it trades at an all-time high (in reality, entry for PAA needs to be delayed until a completed pullback). M&G takes 2%, with the thinnest cover of the eight (1.15) and a net loss over the past year.
Concentration caps. No stock above 3.5% and no bond above 7.5% of the portfolio. Four of the eight stocks are UK financials, so together they are capped at 12%, which trims Investec to 3% despite its 1.78 cover.
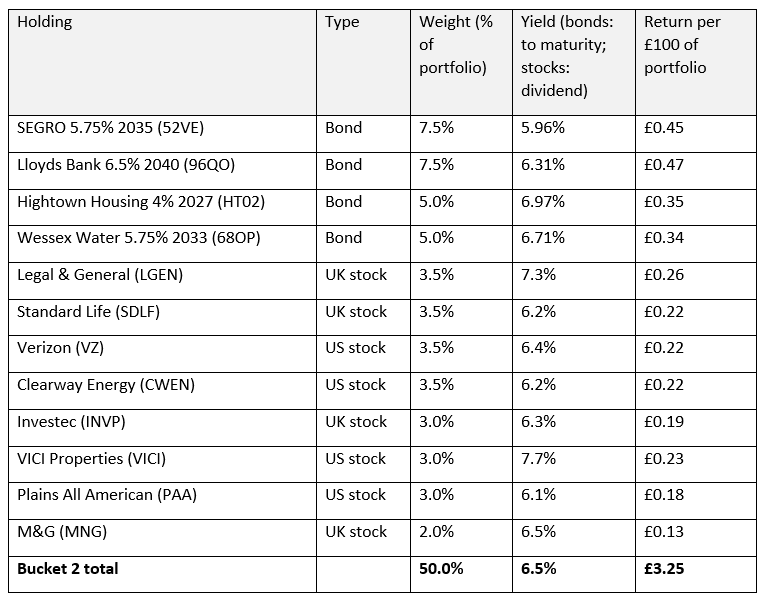
Bond yields are to maturity, as estimated in the retail bond chart above, so they include the rise to £100 on Hightown and Wessex as well as the coupons. The four bonds yield 6.4% on this weighting; the cash they pay out each year is lower, at 5.7%. Currency exposure is 37% sterling and 13% US dollars as shares of the whole portfolio, the dollar exposure is all in the four US stocks. Hightown’s repayment in October 2027 is the first reinvestment decision.
Bond funds and dividend ETFs: not used because of lower yields
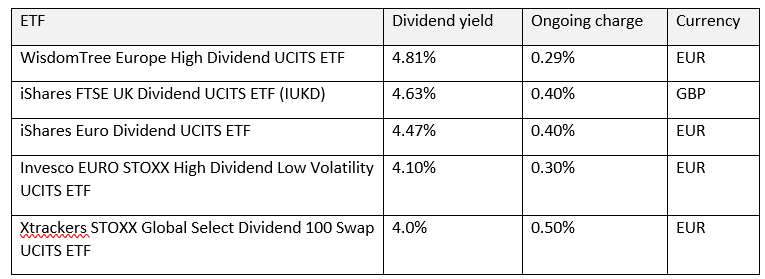
The two bond funds yield 5.7%, against 6.4% to maturity for the four bonds. The five dividend ETFs yield 4.0–4.8%, against 6.6% for the eight stocks.
Bucket 3: long-term growth (35%)
Bucket 3 keeps a third of the portfolio in equities, but most of it sits in a premium-income ETF rather than single growth stocks. A second ETF, XDND, joins after a pullback. The modelled return is 7.6% a year, about four fifth of it paid out as income.
The anchor: a premium-income global equity ETF
The JPMorgan Global Equity Premium Income UCITS ETF (JEGP) holds what JPMorgan calls “a higher-quality, lower-beta portfolio of global large cap equities” and sells index call options against it every week (JPMorgan). It pays about 7.7% for an ongoing charge of 0.35%.
JPMorgan says the fund aims for “a significant portion of the returns associated with the MSCI World Index with less volatility” and is “designed to reduce downside exposure by forgoing some upside participation”. In a de-risking plan that is the point: it keeps the portfolio in global equities while turning part of the upside into monthly cash.
Alternatives were screened on yield, cost and how much upside they give away:
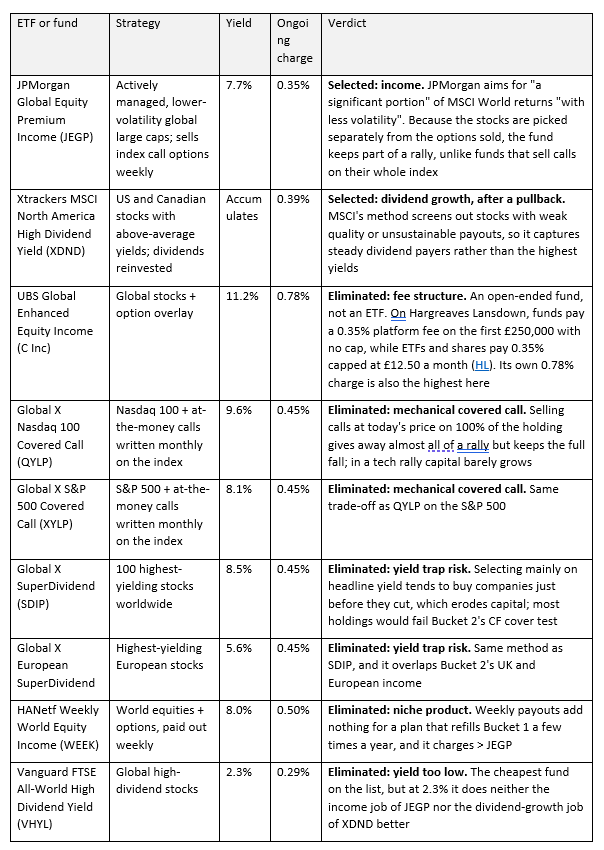
JEGP wins on the balance of cost and give-up: funds that sell calls on the whole index surrender most of a strong rally, and a distribution above the fund’s total return is paid partly out of capital. XDND does a different job. It holds North American companies with above-average yields that pass quality and payout screens, and reinvests their dividends, so it compounds in the growth bucket rather than paying out. It also balances Bucket 2, whose stocks lean to the UK.
Timing: XDND waits for a pullback
XDND is up about 20% this year, so buying it now would lock in a high entry price for a long-term holding. Until it pulls back, its share of Bucket 3 is split between JEGP and a budget for individual growth stocks. JEGP keeps that money in global equities and paying income; the growth budget keeps some exposure to companies that compound faster than option-selling funds allow.
Expected returns
The plan models about 6.6% a year in total, of which about 5.9% arrives as cash income. The figures below are for the first full year once the buckets are invested, while XDND is still waiting for a pullback.
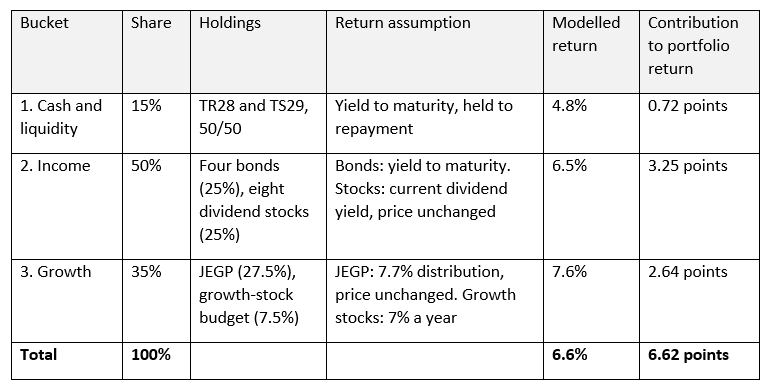
The assumptions behind these numbers:
Capital for growth stocks: 7.5% of the portfolio, about a fifth of Bucket 3, with the other 27.5% in JEGP. This holds until XDND and/or Nasdaq pull back and can be rebalanced to include these two.
Growth-stock return: 7% a year in total, a deliberately modest figure for a small, concentrated sleeve. No dividends are counted.
JEGP: its 7.7% distribution is counted as its return, with no change in price. In a weak market, option-income funds can pay out more than they earn, so this is the assumption most likely to miss.
Dividend stocks: today’s yields for a year, with no price change and no credit for dividend growth.
Bonds and gilts: held to maturity, with no defaults.
Costs and tax: returns are before platform and fund charges.
Cash income is lower than the total because the gilts’ and bonds’ rise to £100 arrives only at maturity: Bucket 1 pays about 5.0% in cash, Bucket 2 about 6.1%, and JEGP 7.7%. Once XDND and/or more growth stocks are bought, Bucket 3 pays out less cash, because XDND reinvests its dividends and growth stocks pay little dividends.
Risks and trade-offs
De-risking swaps one set of risks for another: less exposure to an equity crash, more to rates, credit and dividend cuts.
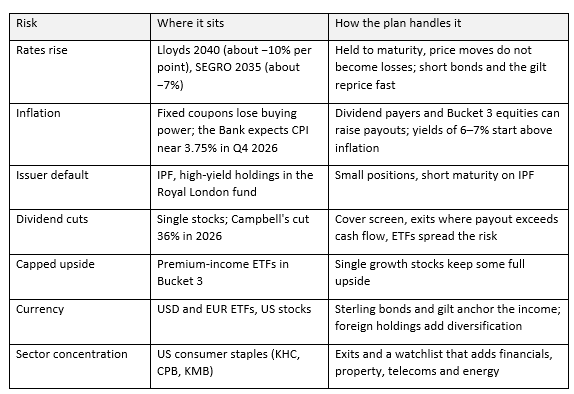
The largest trade-off is opportunity cost. If the AI rally runs for years, a 35% growth bucket with much of it in option-selling funds will trail an all-equity portfolio. The plan accepts that in exchange for income that does not depend on the market’s mood.
Review the plan once a year, and whenever Bank Rate moves by 1 point or more from 3.75%.
Sources
ONS: Consumer price inflation, September 2026
Fitch via IPF: Fitch affirms International Personal Finance at BB
Hightown: Moody’s A3 rating, December 2025
The Water Report: Wessex slips out of Moody’s Baa1
Hargreaves Lansdown: corporate bond prices (retail bond data)
This article is for information, not investment advice. Yields, prices and returns are as of October 2026 and will change. Some instruments named here are classed as complex.
Income
Explore all company fundamental valuations, DCF intrinsic models, and thematic deep-dives in Income.
Quantitative Models
Automated daily equity screening across 6 quantitative factor models with 15-minute EMA regime confirmation.
More Research from the Desk
Signals and themes from quant strategies after last week’s earnings: FTNT, F5 and healthcare
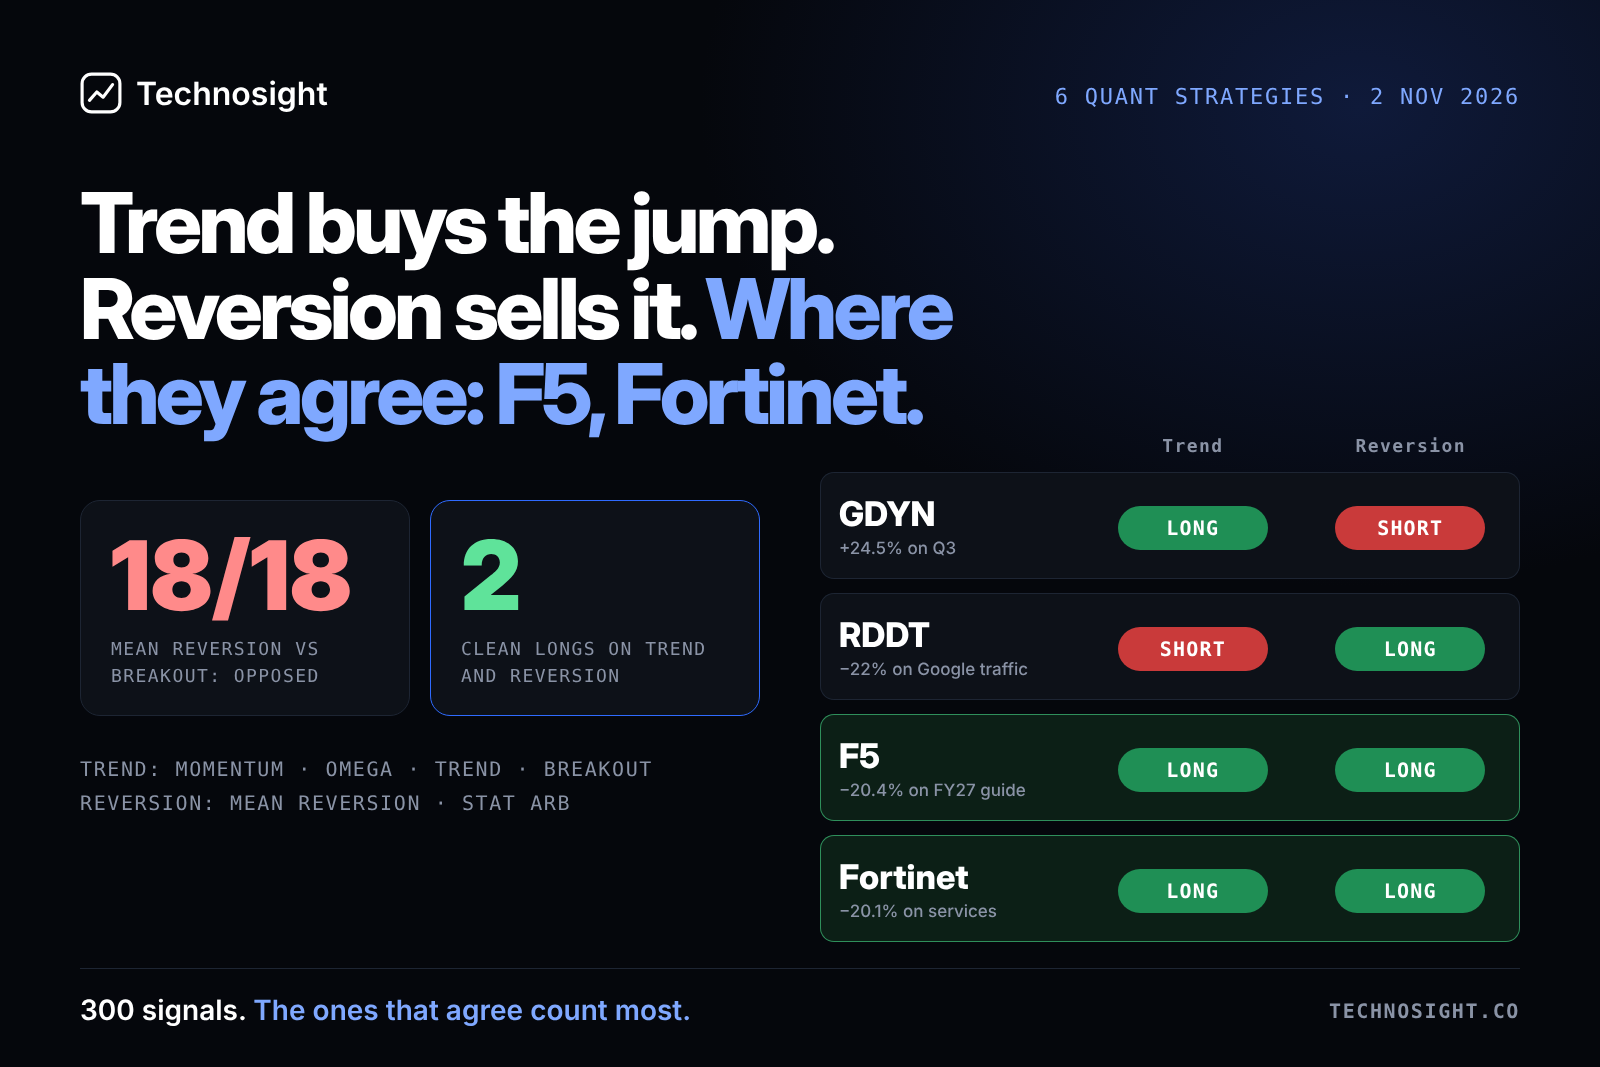
We reviewed 300 signals from our six quant strategies together. Strategies split into two families (trend and reversion) that read last week’s earnings in opposite ways. The trend family (Momentum, Momentum Omega, Trend Following, Volatility Breakout) is buying the stocks that jumped, such as Grid Dynamics (+24.5% on 30 Oct) and Regeneron (+11.5%). The reversion family (Mean Reversion, Statistical Arbitrage) is shorting them and buying the stocks that fell, such as Reddit (−22%). The most valuable signals are the ones both families back: F5 and Fortinet, each long across both families with no votes against them, each down about 20% after beating on the quarter and guiding to slower growth. Beyond the stocks, two themes stand out: healthcare catalysts lead momentum, and the market is selling companies that guide lower or pay heavily for AI.
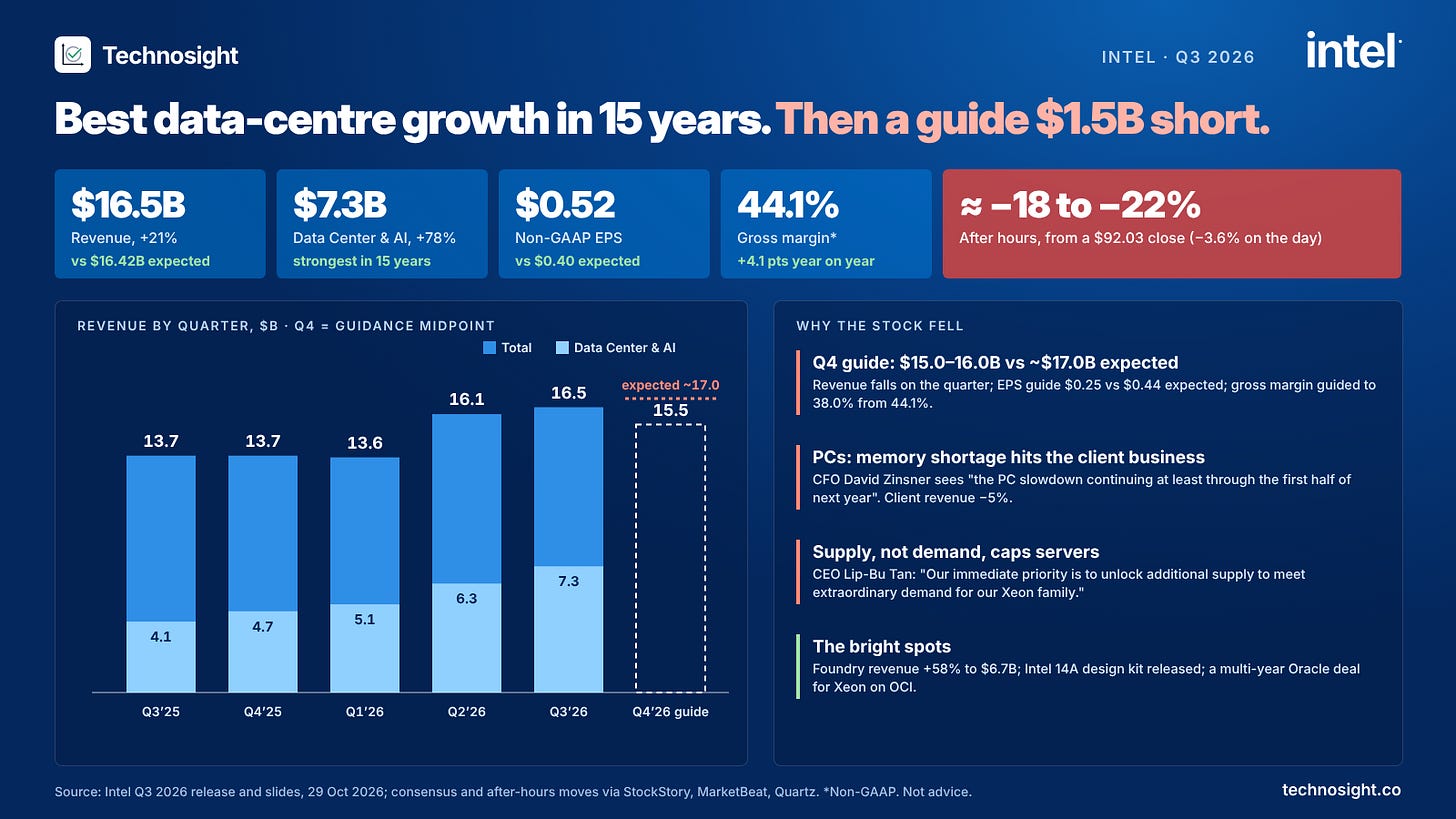
Intel Inc (INTC) earnings: data center jumps 78%, but Q4 guidance cut triggers 25% sell-off
Intel’s Q3 print delivered a stark contrast between a surging Data Center business (+78% YoY to $7.3B) and a severe guidance reset. While Q3 beat top- and bottom-line estimates ($16.5B revenue, $0.52 non-GAAP EPS), Q4 revenue guidance ($15.0B–$16.0B vs. $17.1B consensus) sent shares down ~25% pre-market. Management highlighted supply bottlenecks in substrate packaging, a memory-driven PC downturn running into H1 2027, and a $300M revenue hit from the Fab 28 explosion in Israel. With capex ramping for 18A/14A and 2027 expected to be cash-flow negative, we adjust the score from -2/10 to -1/10 Neutral.