
9% dividend diversified portfolio, tested for cover
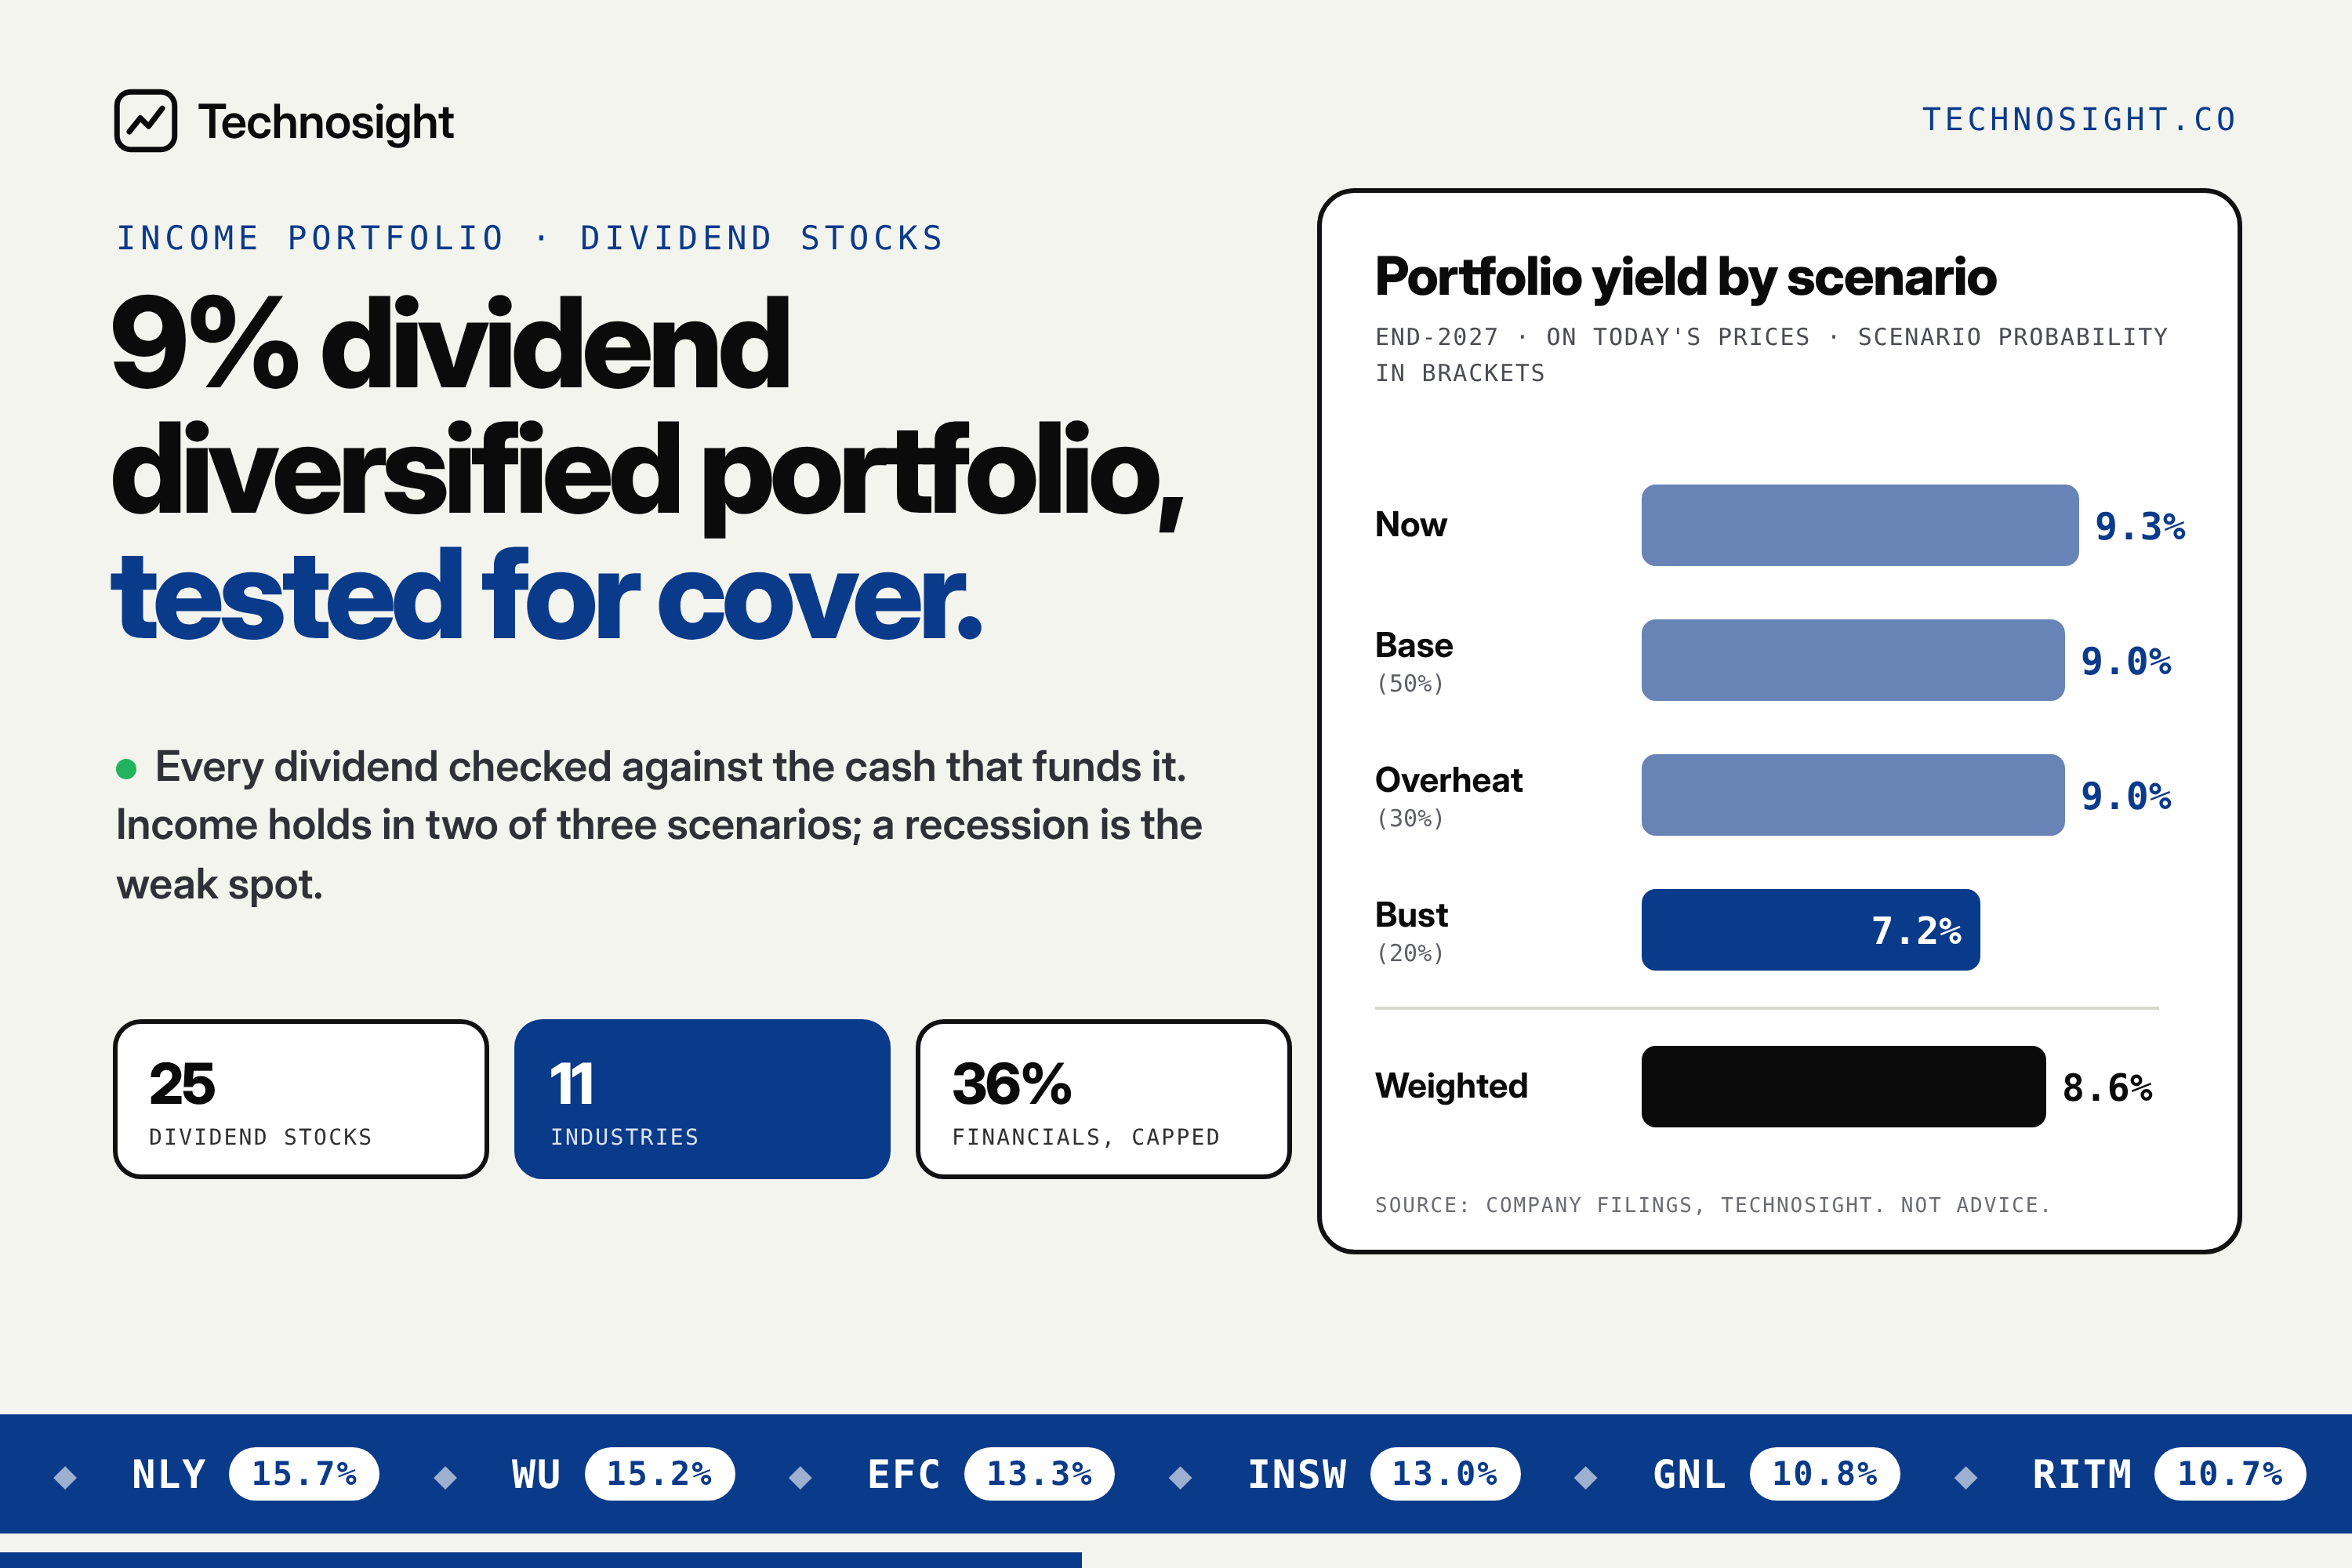
Our dividend stocks pass the cover test that fits its business: distributable earnings for lenders, AFFO for landlords, free cash flow for operating companies. Financials pay the most but share one risk, the credit cycle, so they are held to 36%. Two dividends were cut this quarter, Blackstone Mortgage Trust’s to $0.30 and Telefónica’s by half, and both count at the new rate. In our end-2027 scenarios, income holds at about 9.0% in Base and Overheat, which carry 80% of the weight, and falls to about 7.2% in Bust as tanker, oil and thinly covered payers cut. Where share prices go nowhere, the dividends still pay about 9%. In a recession, the bonds have to carry more of the load.
9% dividend diversified portfolio, tested for cover
25 stocks across 11 industries. In our end-2027 scenarios, income holds at 9.0% in Base and Overheat and falls to 7.2% in Bust.
Research series: research on building a portfolio from sovereign and corporate bonds, dividend stocks and growth stocks, held in a UK tax-free wrapper (SIPP or ISA). Earlier research:
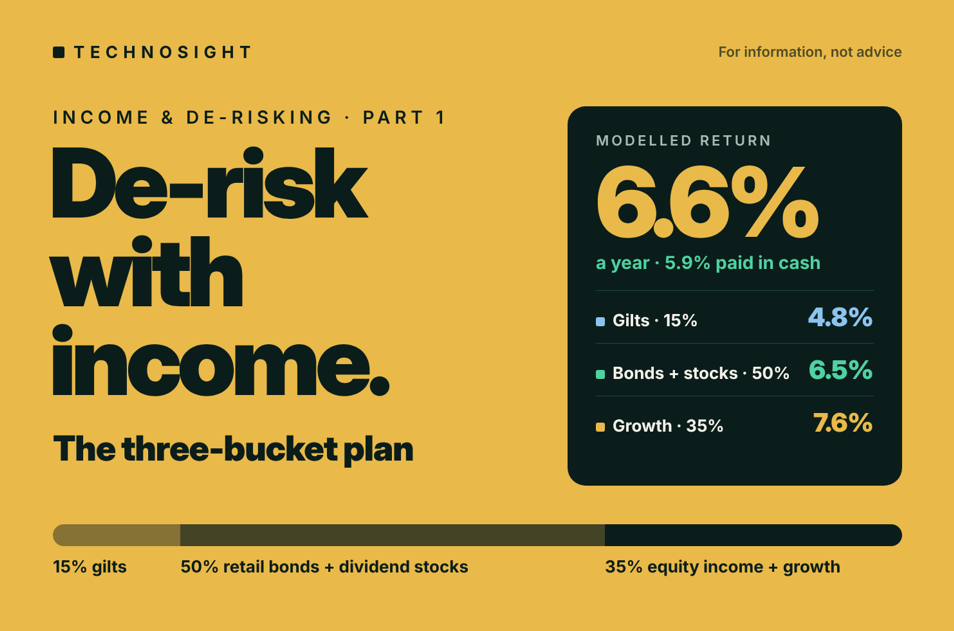
De-risking a portfolio with gilts, dividend stocks and bonds for a modelled 6.6% a year
Where will the market be by end-2027 and what to own
High-dividend stocks: which yields are real?
This portfolio holds 25 dividend stocks across 11 industries and yields about 9% gross. No industry group is more than 17% of the total, and financials are 36%.
These stocks are the equity-income part of a wider income portfolio, alongside gilts, UK corporate bonds and premium-income ETFs, described in: De-risking a portfolio with gilts, dividend stocks and bonds for a modelled 6.6% a year
The gilts and bonds are the steady base. This article covers the dividend stocks, where the yield and the risk are both higher.
The aim is a high yield without relying on one source of income. Lenders, asset managers and banks pay some of the highest yields, but they all depend on the credit cycle, so their share is capped. The rest is spread across property, energy, shipping, consumer, telecom, media and industrials.
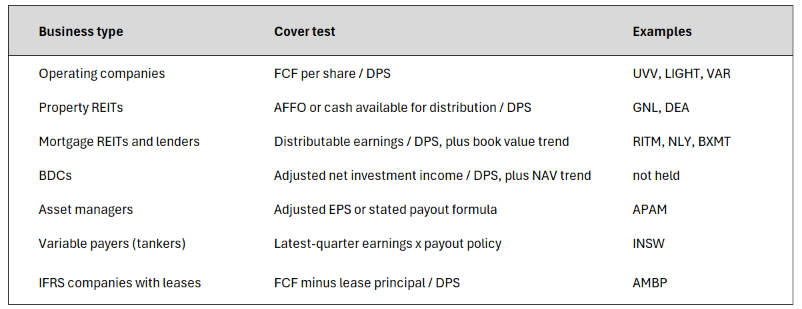
Every holding passes the dividend cover test for its business type, set out below.
The rules
Every name had to pass four tests before it earned a slot.
Size and yield. Market cap above $1B and a dividend yield near or above 8% for new buys. Three older holdings below that (KHC and VZ at 6.4%, MNG at 6.5%) stay because they anchor groups that would otherwise be empty or riskier. Yields are gross, before any withholding tax.
A forward-looking TTM dividend. We count the last four quarters, but a cut counts at its new rate. Special dividends count only if paid consistently over eight quarters.
The right cover test for the business. Free cash flow per share against the dividend works for operating companies, not for lenders or landlords:
A cap per industry group. About 15% for the highest-yield groups (lenders, property), 8% for most others, 4% for single-name or variable-dividend groups. No group should carry more than its share of the income.
Allocation by industry
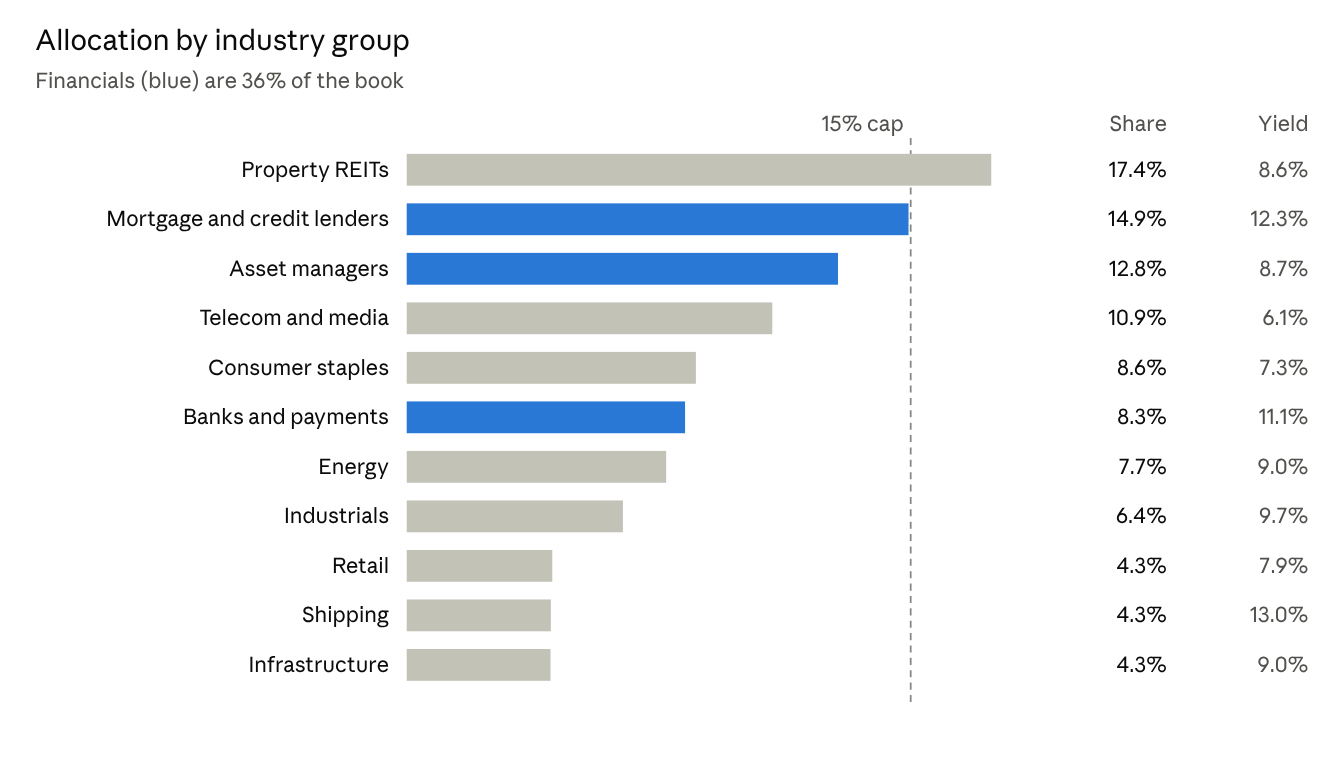
Property is the largest group at 17%, just above the 15% cap, because PHP and VICI are held from before. Lenders yield the most at 12.3%, telecom and media the least at 6.1% after Telefónica’s cut.
The holdings
Twenty-five stocks, sorted by group and yield.
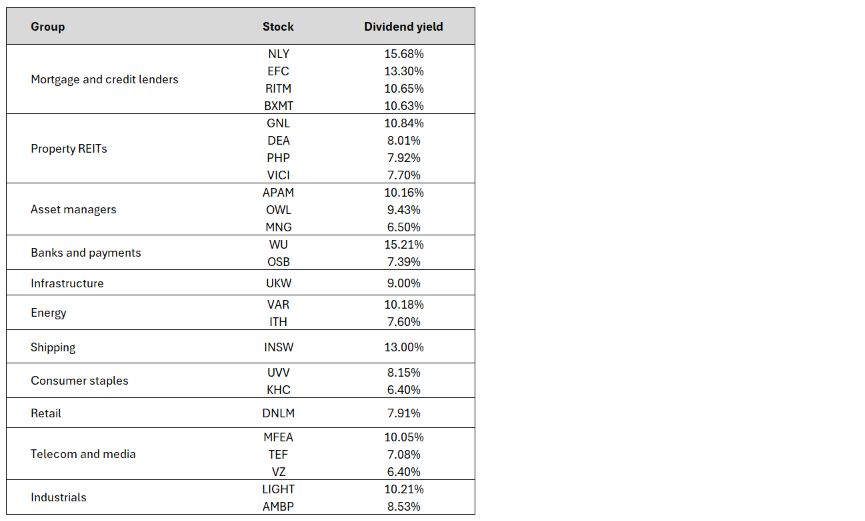
Yields are trailing twelve months, with a cut counted at its new rate. For each stock: what it pays, what covers it, and what management has said about funding it.
Mortgage and credit lenders
Annaly (NLY), 15.7%. Q3 earnings available for distribution were $0.80 a share against a $0.75 dividend, 1.07x cover. CEO David Finkelstein said earnings were “once again exceeding the common stock dividend”, reflecting “durable earnings power”. Book value fell 11.4% in Q3 to $17.86 as rates rose, with leverage at 5.9x.
Ellington Financial (EFC), 13.3%. Q3 adjusted distributable earnings were $0.45 a share against $0.39 of dividends, 1.15x cover. CEO Laurence Penn: the company “produced adjusted distributable earnings in excess of our dividends.” Book value held at $13.53 after paying the dividend.
Rithm Capital (RITM), 10.7%. Q3 earnings available for distribution were $0.55 a share against a $0.25 dividend, 2.2x cover. CEO Michael Nierenberg: “28 consecutive quarters where our EAD was greater than dividends paid.” Book value rose to $12.51 in Q3; the dividend has been $0.25 since 2020 while earnings are retained to grow the servicing and asset management businesses.
Blackstone Mortgage Trust (BXMT), 6.8% after the cut. Q3 distributable earnings were $0.38 a share ($0.42 before realised losses) against a $0.47 dividend. The board cut the Q4 dividend to $0.30, payable 15 January 2027. CEO Tim Johnson called $0.30 a level “which we believe can be sustained”. That is 1.3x Q3 earnings.
Property REITs
Global Net Lease (GNL), 10.8%. Q3 AFFO was $0.22 a share against a $0.19 dividend, and 2026 guidance of $0.83–0.85 covers the $0.76 annual dividend 1.1x. CEO Michael Weil: “I think that the equity is mispriced, not the dividend... I am comfortable and confident in our ability to continue at this dividend level.” Net debt is 6.5–6.9x EBITDA, with nothing maturing until Q4 2027.
Easterly Government Properties (DEA), 8.0%. Q3 cash available for distribution was $0.67 a share against a $0.45 dividend, 1.5x cover. CEO Darrell Crate put the payout ratio “right around 67%”, down from 117% in 2023. Tenants are mostly US federal agencies on 9.2-year average leases; 2027 core FFO is guided at $3.09–3.17, about 1% growth.
Primary Health Properties (PHP), 7.9%. The 2026 dividend of 7.3p is “fully covered”, with H1 adjusted earnings of 3.8p a share, up 9%. It is PHP’s 30th consecutive year of dividend growth. Management targets loan-to-value below 50% over time, from the low 50s now.
VICI Properties (VICI), 7.7%. 2026 AFFO guidance was raised to $2.47–2.48 a share, covering the dividend about 1.3x. VICI has raised its dividend every year since listing, the latest being the ninth, and has authorised a $2B buyback. All remaining 2026 debt maturities were refinanced with $1.75B of notes at 5.42%.
Asset managers
Artisan Partners (APAM), 10.2%. APAM pays “approximately 80% of the cash the Company generates each quarter”, plus an annual special from the remaining 20%. Trailing dividends total $4.03, including the $0.88 Q3 payment, which is 85% of Q3 adjusted EPS of $1.03. CFO C.J. Daley: “Our strong balance sheet and cash generation provide the flexibility to continue investing in our business while maintaining an attractive shareholder return profile.” The dividend moves with equity markets: it fell 40% in 2022.
Blue Owl Capital (OWL), 9.4%. The 2026 dividend is set at $0.23 a quarter, $0.92 for the year. Q3 distributable earnings were $0.24 a share, the first quarter this year above the dividend; over nine months the payout was 106% of earnings. Covering the full year needs Q4 earnings of about $0.27.
M&G (MNG), 6.5%. The interim dividend rose to 6.8p from 6.7p under a “progressive, but not guaranteed, dividend policy.” H1 operating capital generation was £372m, almost halfway to the £2.7bn three-year target, and the Solvency II ratio rose to 247%. About half of M&G’s capital generation comes from life insurance and annuities rather than fund fees.
Banks and payments
Western Union (WU), 15.2%. The dividend has been $0.235 a quarter through 2025 and 2026. Adjusted EPS guidance of $1.28–1.38 covers it about 1.4x, but nine-month free cash flow of $191M covered only 0.84x of the $226.5M paid. CFO Matthew Cagwin: “we have paused our buyback activity to support our goal of maintaining a debt-to-EBITDA ratio of 2.5x to 3x.”
OSB Group (OSB), 7.4%. The interim dividend rose 5% to 11.8p, with a £100m buyback under way. The CET1 capital ratio is 15.2%, and OSB has returned more than £1.3bn to shareholders since 2019.
Infrastructure
Greencoat UK Wind (UKW), 9.0%. The 2026 target is 10.7p, the 13th consecutive inflation-linked increase. H1 dividend cover was 1.9x, on net cash generation of £222m. NAV is 134.1p a share.
Energy
Vår Energi (VAR), 10.2%. Vår pays $350M a quarter under a “long term dividend policy of 25-30% of CFFO after tax over the cycles”, and guided Q3 at the same $350M. Free cash flow covers the dividend about 2.4x.
Ithaca Energy (ITH), 7.6%. Ithaca raised its 2026 dividend guidance to $500–530M and reaffirmed its policy of returning 30% of post-tax cash flow from operations. Leverage is 0.49x, with $1.9bn of liquidity.
Shipping
International Seaways (INSW), 13.0%. INSW pays out most of its earnings each quarter with no fixed amount; the Q3 dividend was $5.05. Net loan-to-value is below 6%, so the payout is not limited by debt. It is limited by tanker rates, which are currently lifted by the Middle East conflict.
Consumer staples
Universal Corporation (UVV), 8.2%. UVV has raised its dividend for 56 consecutive years. Cover is thin: fiscal 2026 adjusted EPS of $2.64 covers it 0.8x, and free cash flow over the year to September covered about 0.3x after shipments were delayed by oversupply. The CFO wants to cut debt “to support EPS and dividend coverage ratios”.
Kraft Heinz (KHC), 6.4%. The $0.40 quarterly dividend has been unchanged for eight quarters. CFO Andre Maciel said free cash flow was tracking “the same dollar amount essentially that we have committed at the beginning of the year”, and $1.9bn of debt was repaid in Q2.
Retail
Dunelm (DNLM), 7.9%. Fiscal 2026 brought a 45.5p ordinary dividend, up 2.2%, plus a 25p special, down from 35p. Free cash flow of £154.8m covered the total about 1.1x, and net debt fell to £94.6m.
Telecom and media
MediaForEurope (MFEA), 10.1%. MFE pays once a year; the 2026 dividend was €0.22, down 18.5% from €0.27 after the ProSiebenSat.1 takeover.
Telefónica (TEF), 3.8% after the cut. Telefónica halved its dividend: the 2026 payment is €0.15 a share, paid in June 2027. From 2027 the payout will be 40–60% of free cash flow, as the company prioritises investment and debt reduction.
Verizon (VZ), 6.4%. Verizon raised its quarterly dividend to $0.7075. 2026 free cash flow guidance was raised to $22.4–22.5bn, about 1.9x the roughly $11.8bn a year it pays in dividends.
Industrials
Signify (LIGHT), 10.2%. Signify paid €1.57 for 2025, up from €1.56, and aims to “pay an increasing annual cash dividend per share year on year.” 2025 free cash flow of €440m covered the dividend about 2.3x. Buybacks are paused during a strategic review.
Ardagh Metal Packaging (AMBP), 8.5%. AMBP pays $0.10 a quarter with no stated policy; the CFO only “announced our unchanged quarterly ordinary dividend”. After lease payments, 2026 free cash flow covers it about 0.7x, and growth capex rises from $90M to about $250M in 2027. The parent, Ardagh, owns 76% and is exploring a sale.
The high yields we turned down
The biggest headline yields failed the rules, usually because the yield was one-off or the cover test did not hold.
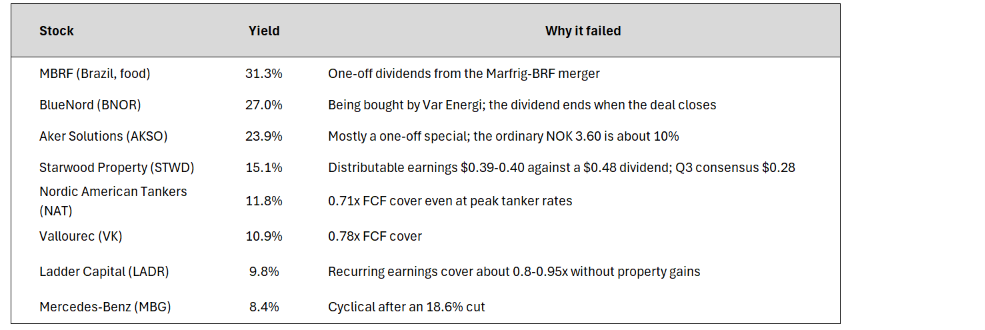
Ladder and Starwood stay on the watchlist. Ladder qualifies once carry earnings alone cover the $0.23 dividend. Starwood becomes interesting if the board resets the dividend close to $0.36–0.40 a quarter.
Risks
Credit: lenders, asset managers and banks carry 36% of the book. A credit downturn would hit NLY, EFC, RITM, BXMT, WU and OSB together.
Rates: property REITs and mortgage REITs reprice when the 10-year Treasury yield moves. GNL at 6.5–6.9x leverage is the most exposed.
Variable dividends: INSW, VAR and APAM set payouts by formula. INSW’s falls when tanker rates normalise; APAM’s falls with equity markets.
Uncovered payers: WU (0.84x FCF over nine months) and AMBP (about 0.7x after leases) are sized and watched for cuts.
Sector gaps: healthcare is still missing, and there are no utilities among the stocks.
Currency
For a sterling investor, about four-fifths of this income arrives in other currencies, mostly dollars. The yields above are in each stock’s own currency, so a stronger pound cuts the sterling value of the income even when no company changes its dividend.
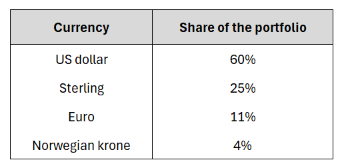
The dollar share is higher than the listing suggests: Ithaca and Vår both declare their dividends in dollars, which takes dollar-linked income to about 73%. A 10% rise in sterling against the dollar would cut the sterling income by about 7%; against all three currencies, by about 8%. The reverse also holds: a weaker pound raises it.
Which way currencies move in each scenario is less clear than which dividends fall, because what matters is the gap between central banks, not one bank’s rate. In Bust, the Bank of England and the ECB would likely cut alongside the Fed. Global recessions have also tended to lift the dollar as a haven and weaken sterling: the pound fell from about $2.00 to below $1.40 between mid-2008 and early 2009, and to $1.15 in March 2020. A weaker pound would cushion the sterling value of the income. The Norwegian krone usually falls with oil, so Vår’s income would shrink further in sterling at $55 oil. In Overheat, UK inflation (RPI 3.9%) and Bank of England hikes would move roughly in step with the Fed, leaving the rate gap little changed.
So we keep currency outside the scenario yields and treat it as a separate swing of about 7–8% in sterling income for each 10% move in the pound. Conversion costs on foreign dividends depend on the platform and are not included in the yields.
Scenarios
The details of the scenarios: Where will the market be by end-2027 and what to own
On today's prices the stocks yield about 9.3%. In our Base and Overheat scenarios that holds near 9.0%; in Bust it falls to about 7.2%. Weighted by the probabilities, the expected yield at end-2027 is about 8.6%. The scenarios are from our 31 October article, Where will the market be by end-2027 and what to own: Base 50%, Overheat 30%, Bust 20%.
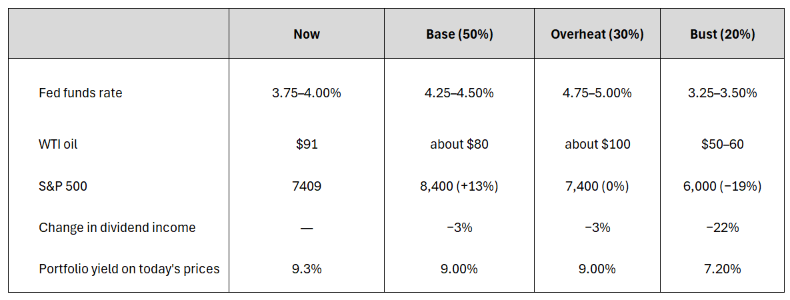
Base: oil fades, income dips 3%. The Strait of Hormuz reopens and the tanker premium unwinds. INSW’s payout, set from each quarter’s earnings, falls by about 40%, the largest single change. Vår and Ithaca pay a fixed share of cash flow, so their dividends fall about 15% as oil drops to $80. Artisan’s formula payout rises about 5% with markets. Every other dividend is unchanged.
Overheat: higher rates, income dips 3%. High oil keeps the energy and tanker payouts where they are, so the hit comes from rates. NLY (−10%) loses book value as yields rise; GNL (−10%) refinances closer to its Q4 2027 maturities at higher rates; AMBP (−25%) carries 5.1x leverage into a heavy capex year; Artisan (−10%) follows a 12–15% market drawdown. RITM is the one that gains, because its mortgage servicing rights rise in value with rates.
Bust: recession, income falls 22%. Most of the loss comes from five places:
Tankers and oil: INSW (−70%) as tanker rates collapse with demand; Vår and Ithaca (−40%) at $55 oil.
Uncovered payers: Western Union (−50%), whose free cash flow already falls short of its dividend, and AMBP (−50%).
Credit: EFC and OSB (−25%), RITM, BXMT and GNL (−20%) as losses rise and lending slows.
Markets: Artisan (−35%) and MediaForEurope (−30%) as assets and advertising fall.
Consumer and industrial: Dunelm drops its special dividend (−35%); Signify (−20%).
The government, healthcare and casino landlords (DEA, PHP, VICI), wind (UKW), Kraft Heinz, Verizon and M&G hold their dividends. Annaly loses less than other lenders because rate cuts lift the value of its agency mortgage bonds.
Income holds in the two scenarios that carry 80% of the weight, which is what the October article asked of it: the expected price return to end-2027 is close to zero, so income has to carry the portfolio. Bust is the weak spot. The stocks would lose about a fifth of their income just as prices fall about 20%, and the holdings that protect in a recession (healthcare, utilities, longer-dated bonds) sit mostly outside this list.
The dividend changes are our estimates, set from each company’s cover and payout policy. Yields are on today’s prices, with no change in holdings.
Putting it together
The portfolio earns about 9% gross without leaning on one channel for most of its income. Lenders and property are the largest groups because they pay the most, but each is held near 15%. Industrials, media, energy and shipping add income that does not depend on credit.
Takeaway: a high-yield portfolio is only as safe as its most crowded group. Holding financials to about a third costs little yield, because the industrial, energy and media names pay 9–10%.
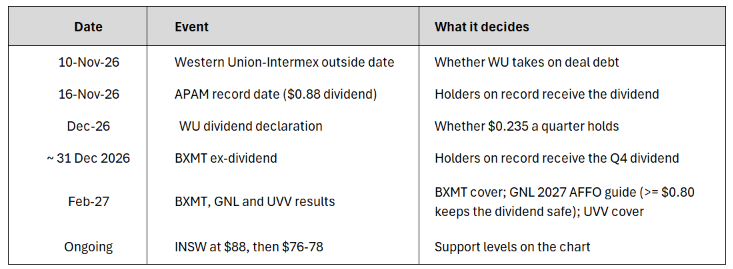
Signposts
Sources:
Not investment advice. Yields are gross and based on trailing dividends, with cuts counted at their new rate.
Income
Explore all company fundamental valuations, DCF intrinsic models, and thematic deep-dives in Income.
Quantitative Models
Automated daily equity screening across 6 quantitative factor models with 15-minute EMA regime confirmation.
More Research from the Desk
High-dividend stocks: which yields are real?
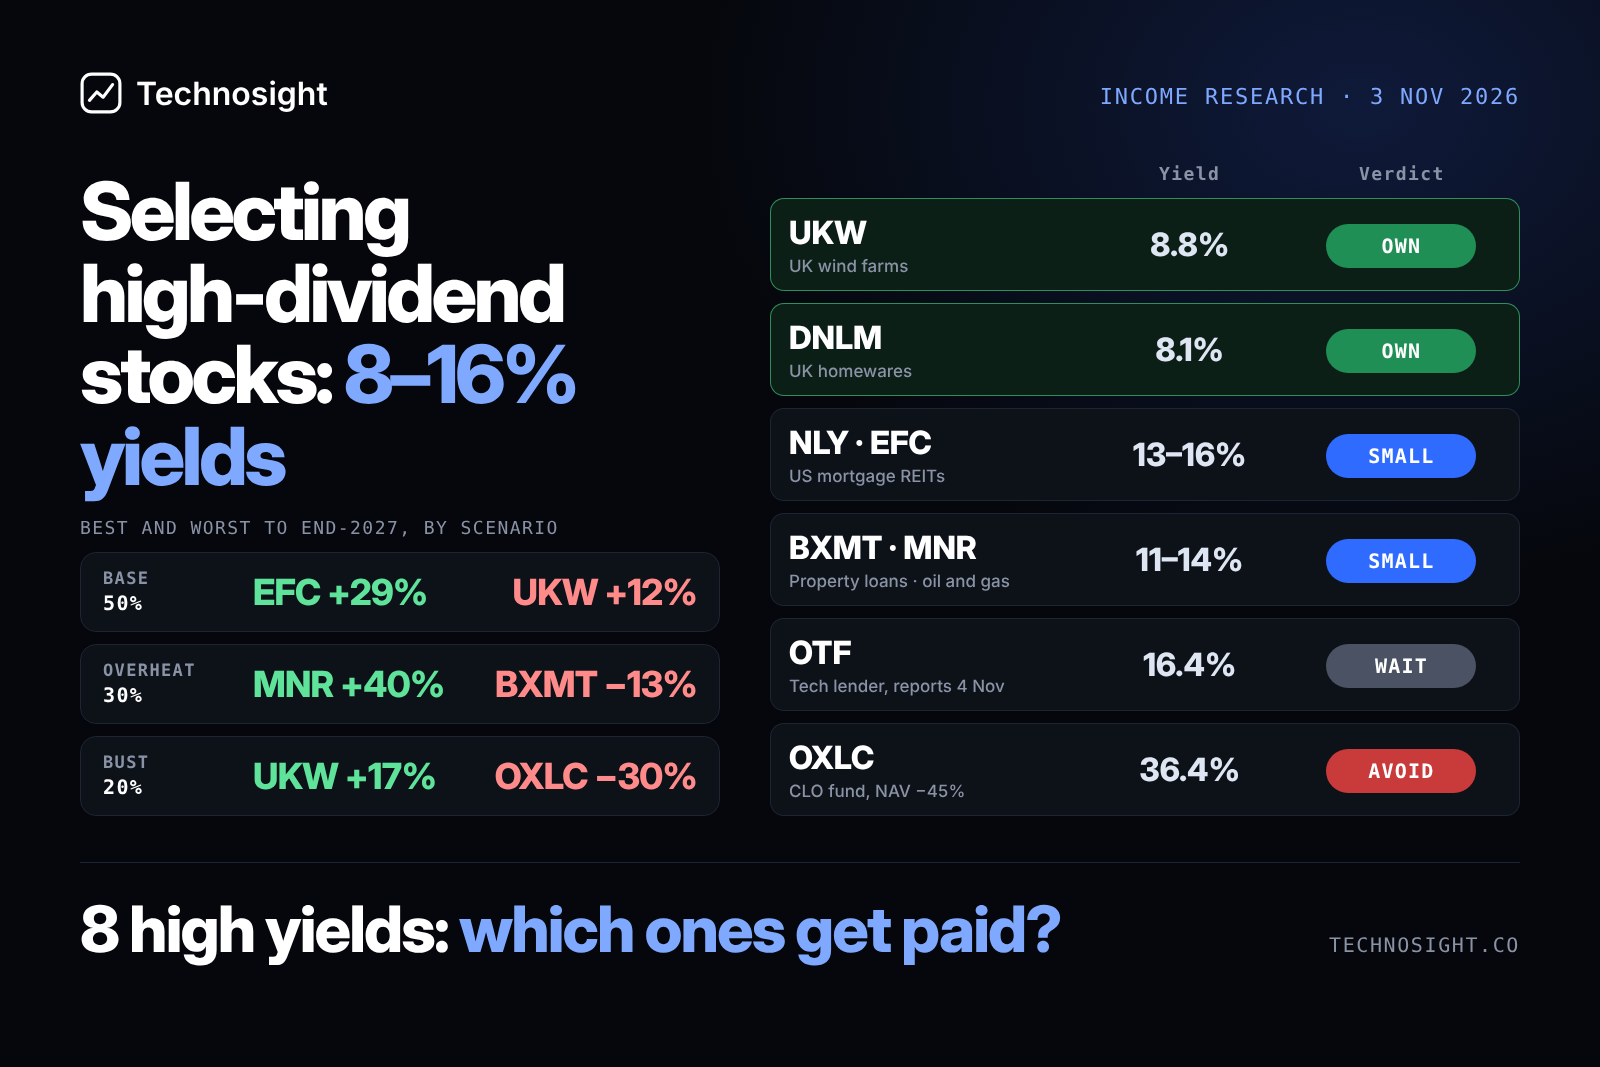
We tested eight high-dividend stocks against our three end-2027 scenarios to find stocks where you can plan on is 8% to 16% dividend yield: Greencoat UK Wind (8.8%) and Dunelm (8.1% including its special) as core income. Own small: Annaly (15.7%), Ellington Financial (9%, monthly), Blackstone Mortgage Trust (10.9% after its cut) and Mach Natural Resources (13.9%, variable) as an energy hedge. Wait: Blue Owl Technology Finance (16.4%), until results on 4 November show whether it cuts. Leveraged US lenders or credit funds lose in our Overheat scenario, where oil stays near $100 and the Fed raises rates to 4.75–5.00%. They borrow to hold loans and bonds, so higher rates raise their funding costs and cut the value of what they hold. They add income, but not protection. Keep them to a small position, and let the inflation-linked gilts, the UK holdings (UKW and DNLM) and MNR’s energy exposure do the hedging.
De-risking a portfolio with gilts, dividend stocks and bonds for a modelled 6.6% a year
After five months of near-zero returns in US equities, this plan moves half a portfolio into assets that pay on schedule. Bucket 1 holds two short gilts to fund two years of spending. Bucket 2 holds four UK investment-grade retail bonds and eight dividend stocks with strong free cash flow and whose dividend rose YoY. Bucket 3 holds two Premium Income and High Dividend ETFs. Modelled return: 6.6% a year, of which 5.9% is in cash. The trade-off: to be rebalanced if the AI rally resumes.