
Momentum Omega: the long-only backtest returned 35% a year. $100K grown to $400K in 4 years
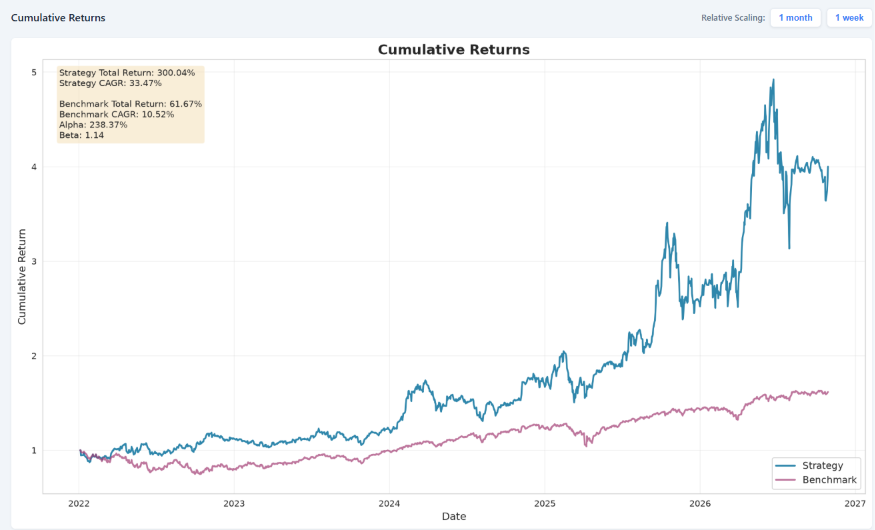
Momentum Omega’s long-only Scenario D1 grew $100,000 to $400,039 in 2022–2026 (33.5% a year, Sharpe 1.00), with a maximum drawdown of −36.4%. The returns are before slippage and carry no benchmark, and seven of today’s ten holdings are AI hardware or memory names.
Momentum Omega is Technosight’s volatility-adjusted momentum model. It compares a stock’s 252-day trend with its latest 21-day move and divides by 126-day volatility. This sceanrio tests the long side only, picking stocks with > $500M daily volume.
Setup. The portfolio holds the ten highest-scoring stocks, equal-weighted, drawn from US stocks with a market cap of at least $2B, a price of at least $5, with 252 days long lookback, 21 days short lookback and 126 volatility window.
A value-at-risk overlay manages risk. The period is 3 Jan 2022 to 28 Oct 2026, starting with $100K.
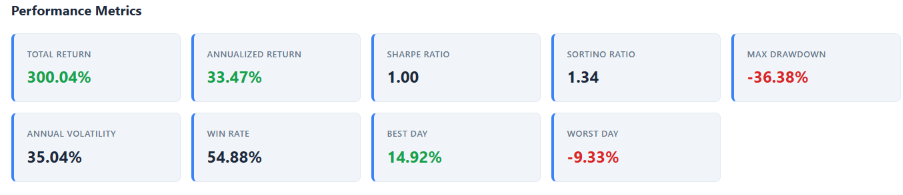
Result. Final value was $400,038.57, a total return of 300.04% or 33.47% a year. Sharpe was 1.00 and Sortino 1.34. Annual volatility was 35.04% and maximum drawdown −36.38%. Win rate was 54.88%, with a best day of +14.92% and a worst day of −9.33%. Commissions came to $3,833.85 across 3,241 transactions, $1.18 on average.
Today’s book. SNDK, AXTI, LITE, MU, STX, ILMN, VLTO, WDFC, INTC and DELL, each 8.5–10.8% of the portfolio, with no changes signalled for the next session. The largest gains are SNDK (+133.91%), AXTI (+53.23%) and LITE (+40.38%). The largest losses are STX (−19.88%) and MU (−13.19%). Seven of the ten are AI hardware or memory names, so the live portfolio carries one theme.
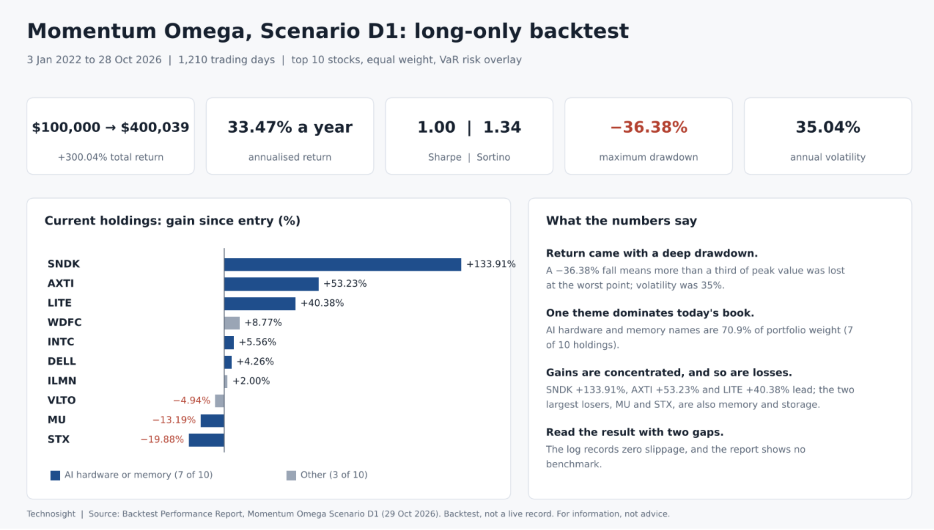
What the backtest does not show. The transaction log records zero slippage, so returns are before the cost of trading at market.. A −36.38% drawdown means more than a third of peak value was lost at the worst point. A backtest is not a live record.
Quantitative Insights
Explore all company fundamental valuations, DCF intrinsic models, and thematic deep-dives in Quantitative Insights.
Quantitative Models
Automated daily equity screening across 6 quantitative factor models with 15-minute EMA regime confirmation.
More Research from the Desk
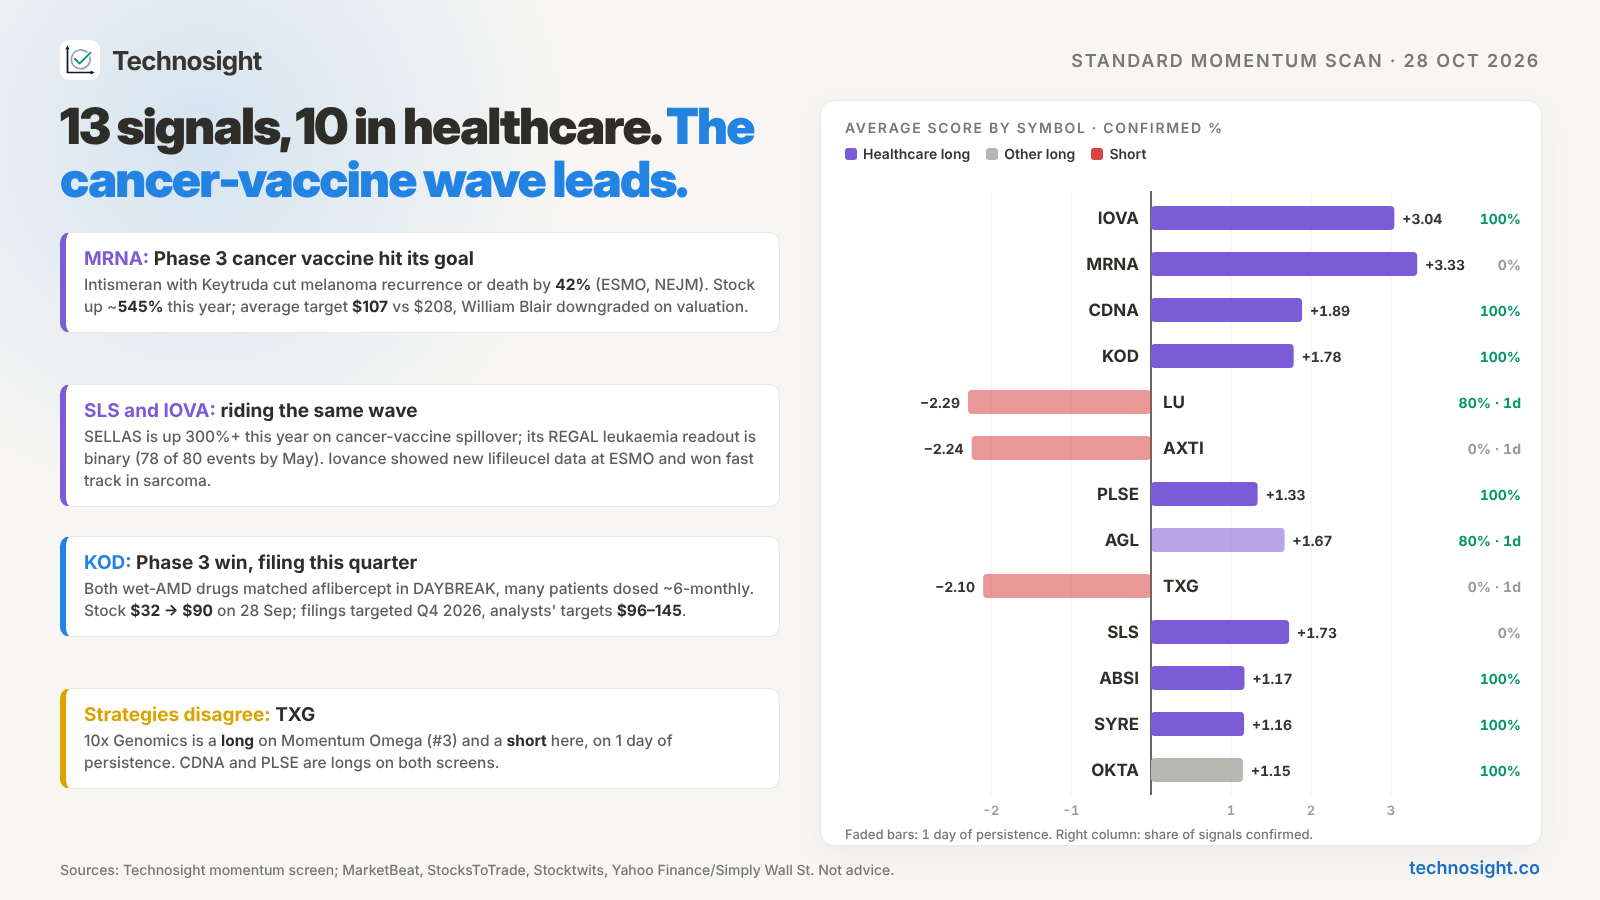
Six quant strategies, 2,000+ stocks a day: what the screens flagged this week
Every day we scan more than 2,000 US stocks with six quant strategies: momentum, volatility-adjusted momentum, mean reversion, statistical arbitrage, trend following and volatility breakout. A signal is a starting point; the research behind it decides whether it’s worth acting on. This week the momentum screens were led by healthcare, with Moderna’s Phase 3 cancer-vaccine win lifting SELLAS and Iovance alongside it, and Kodiak re-rating on Phase 3 eye-drug data. Volatility-adjusted momentum picked up Dell’s $95B AI server backlog. Mean reversion flagged five cybersecurity names as one stretched trade, and showed why every signal needs checking: one short was a takeover target, and one long was cheap because the company had withdrawn guidance. Below are examples from three of the strategies. Full lists, scores and the remaining strategies are for subscribers.
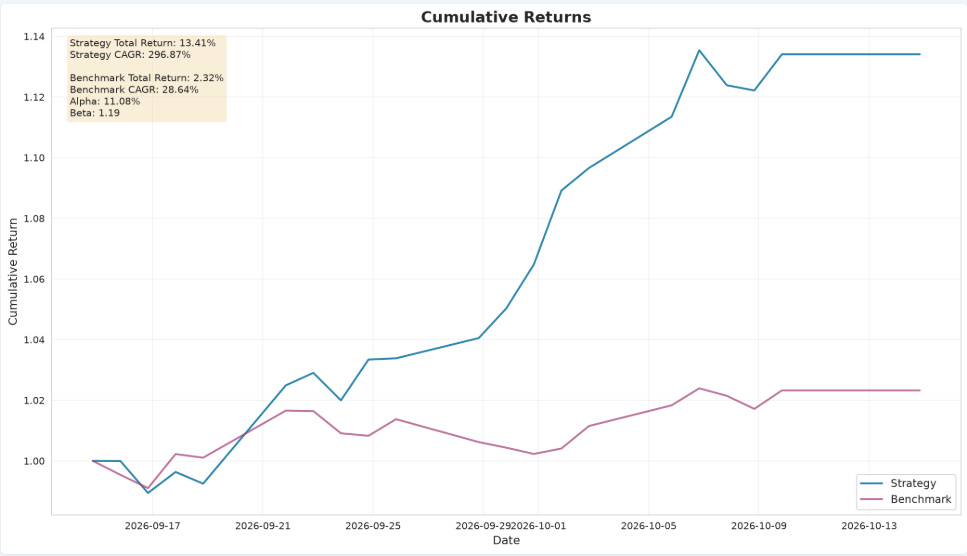
Backtesting: the best performing momentum portfolio over the last month
We perform daily backtesting of our risk-adjusted momentum strategy across 100+ portfolios, built based on combinations of look back parameters and daily trading volume